Ozon
Promotion in Search
Redesigning how sellers manage product promotion in the Promotion in Search tool
seller.ozon.ruperformance.ozon.ru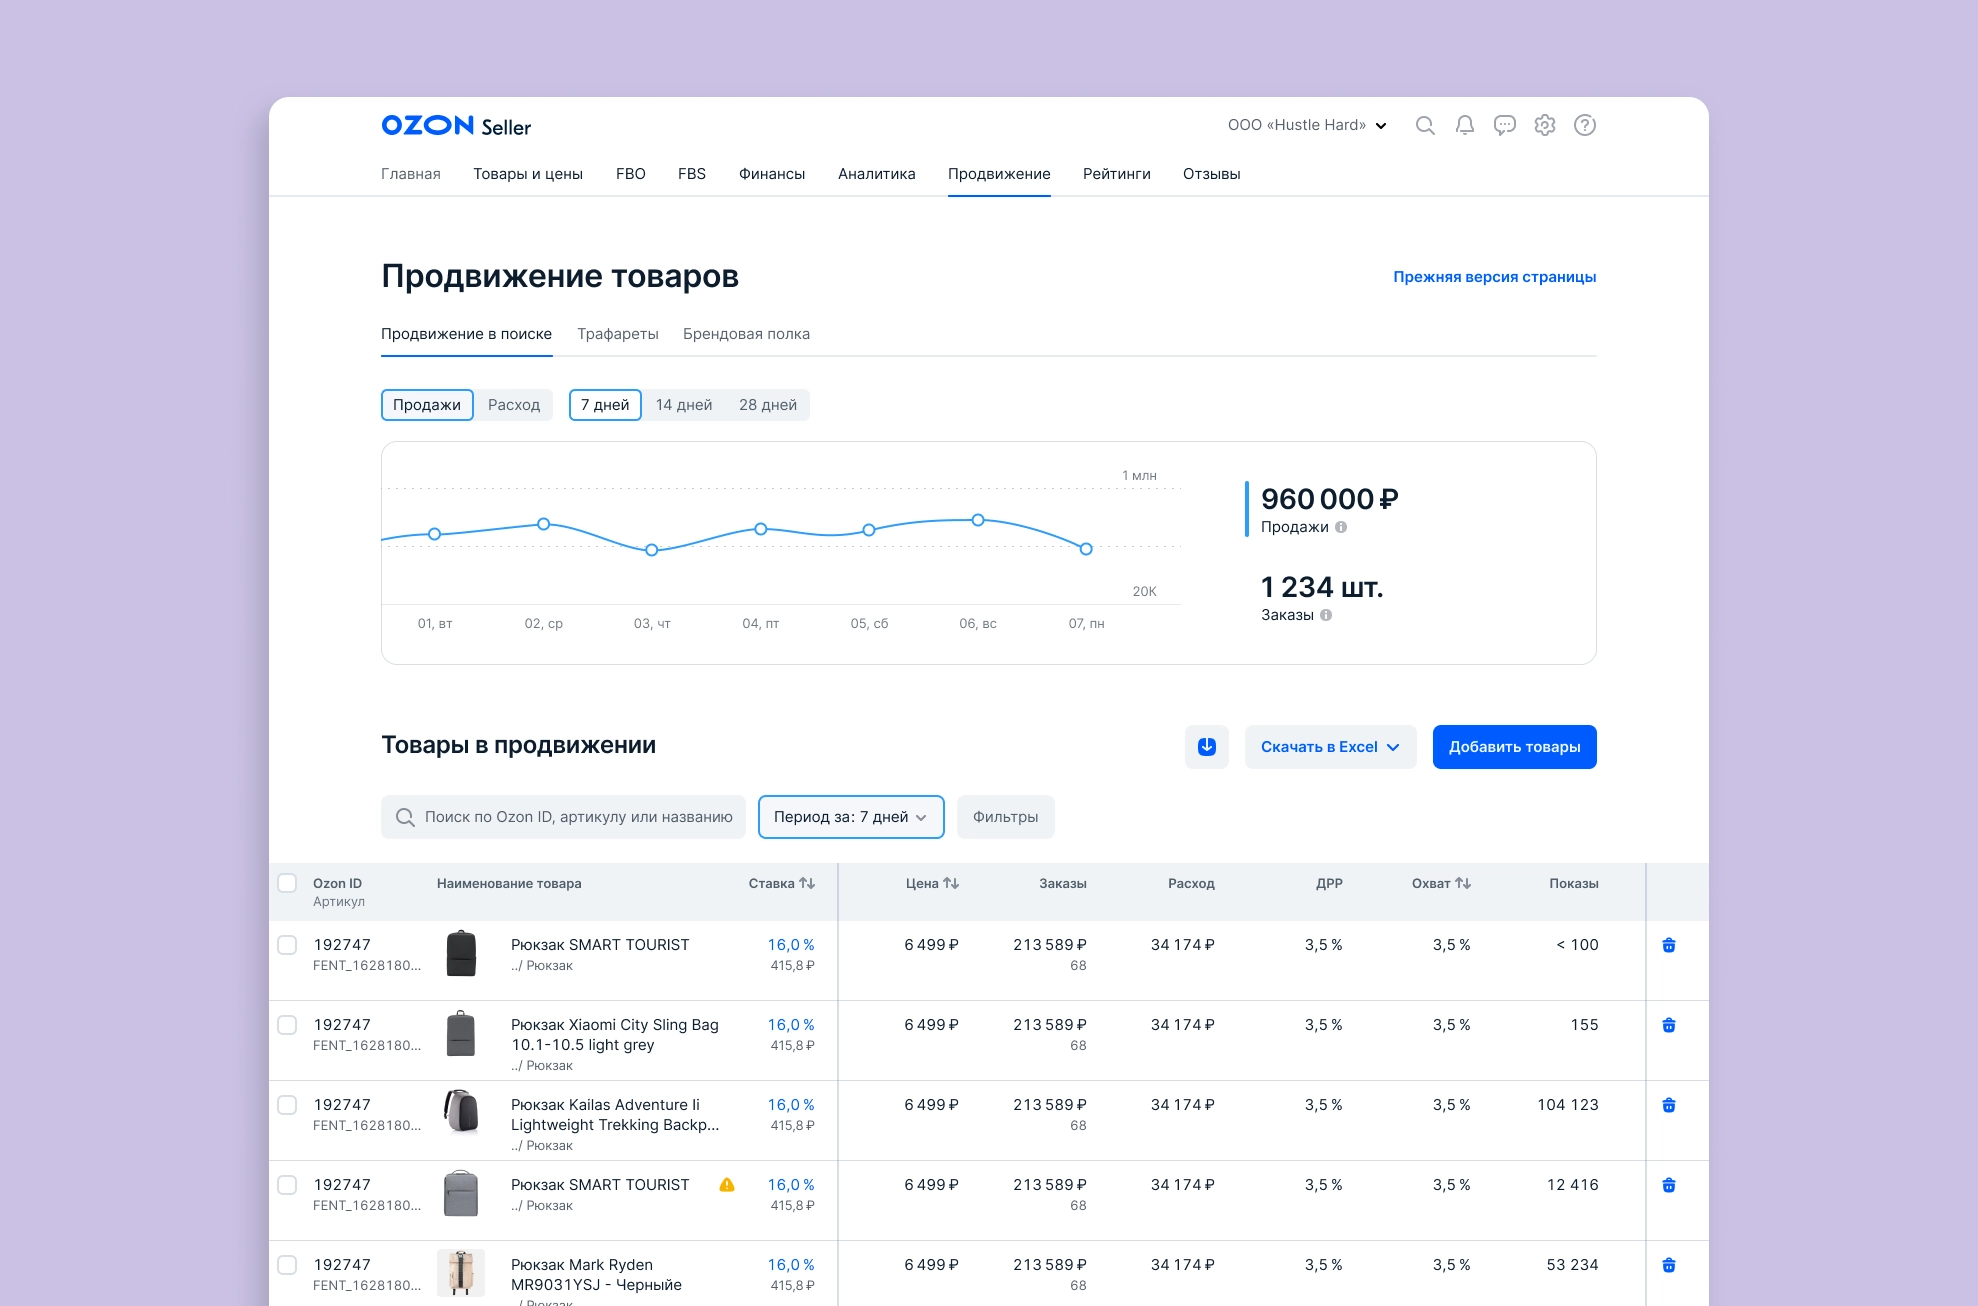
Project details
Promotion in Search helps sellers improve a product’s position in search results. Products promoted through the tool compete for higher placements.
Problems
- The campaign structure made it difficult to increase the number of products covered by CPO bids;
- The same products could appear in several promotion campaigns;
- Metrics were aggregated at campaign level rather than product level;
- Removing a product from promotion required deleting it.
Goal
Make the tool easier to use and scale, and increase the number of products covered by bids.
Tasks
- Design concepts and prototypes;
- Research the concepts and gather seller feedback, especially on metrics;
- Design an MVP within development constraints, addressing product-level metrics, assortment, and product management;
- Design features left out of the MVP and revisions based on feedback.
Research and analysis
Before designing, we interviewed sellers to understand how they used the existing tool. Six companies participated. The main findings were:
- Sellers did not understand how the tool worked or find it transparent;
- Everyone wanted trends over time. They liked the direction of the existing metrics, but some were hard to interpret correctly. The main metrics were sales, spend, ROI, and Search Index;
- Recommended bids were not useful: sellers started at the minimum and increased bids through trial and adjustment;
- Sellers turned off promotion for products already selling well.
We also analyzed how many campaigns sellers had. Almost 70% had just one Promotion in Search campaign. We decided to roll out the redesign to this group first; the remaining 30% used campaigns to group products and would need a separate grouping feature.
Process
Based on the tool review, interviews, and analytics, I prepared a first concept that included:
- Trends over time;
- Product and category recommendations;
- Product management, with products grouped by category;
- An option to add products with poor impression metrics to a Stencils campaign;
- Automatic inclusion of all a seller’s products in the tool, with promotion initially turned off.
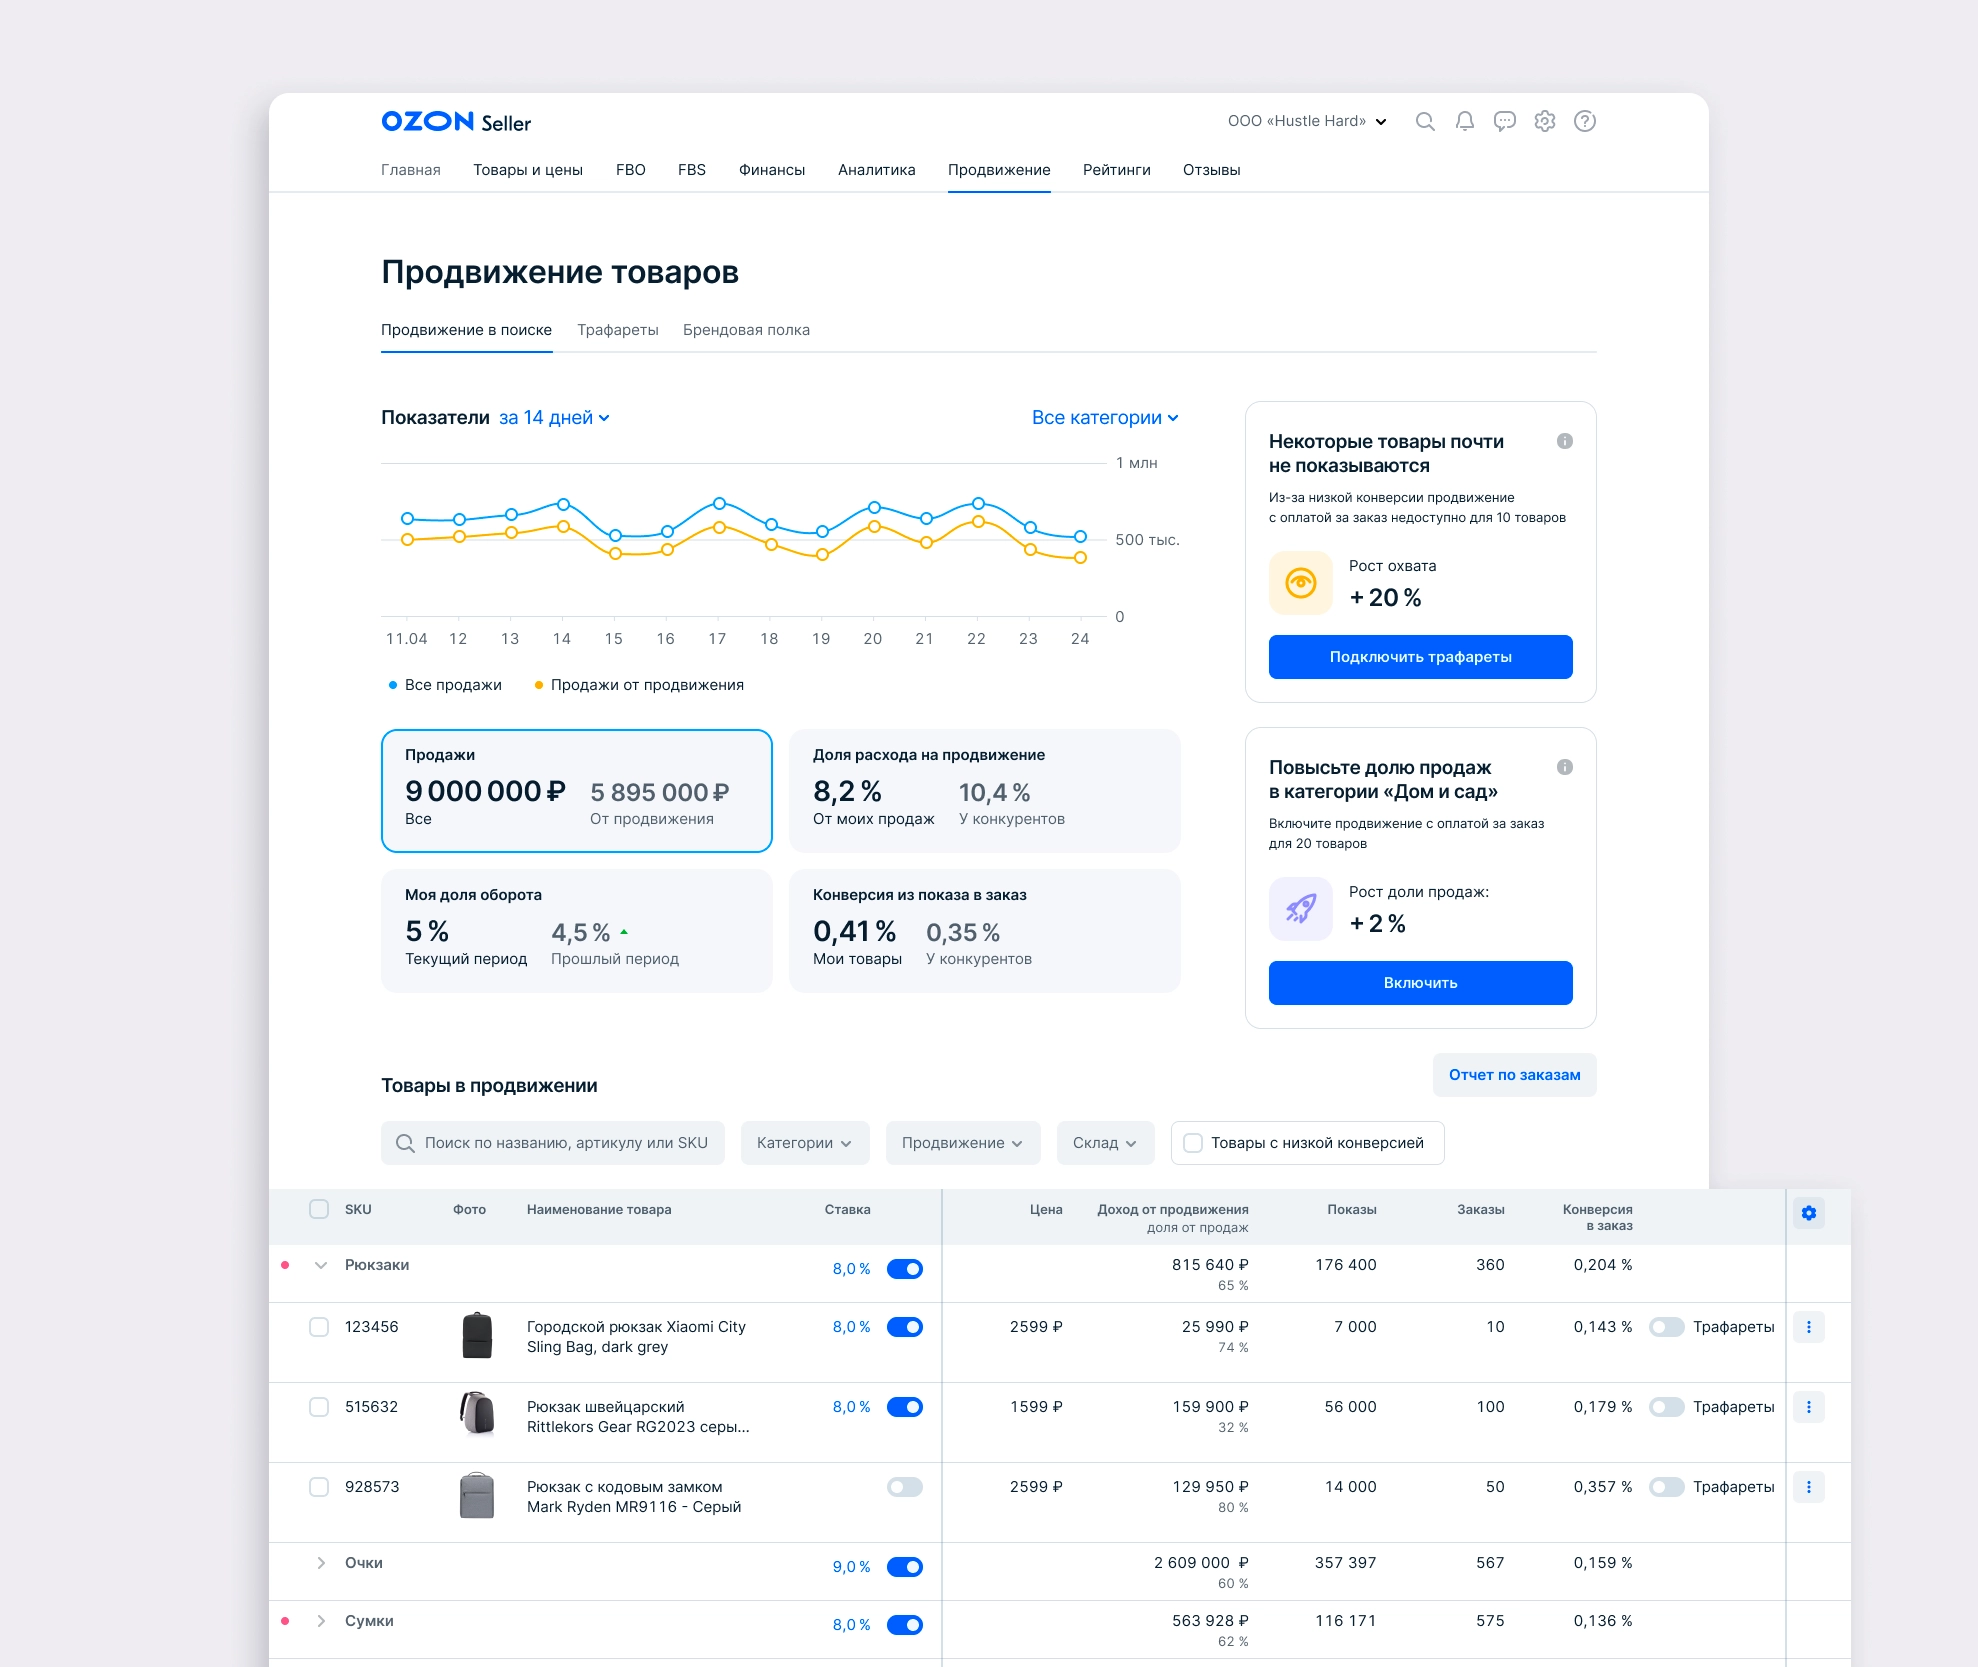
We tested this concept in three interviews and learned that:
- Sellers did not notice the recommendation blocks;
- They did not realize they could view metrics for a selected category or multiple categories in the chart;
- The Stencils feature was unclear;
- They needed to filter poorly performing products by orders and impressions into strong, average, and weak groups;
- Turnover share and conversion were less important in the chart;
- Bulk product management was difficult.
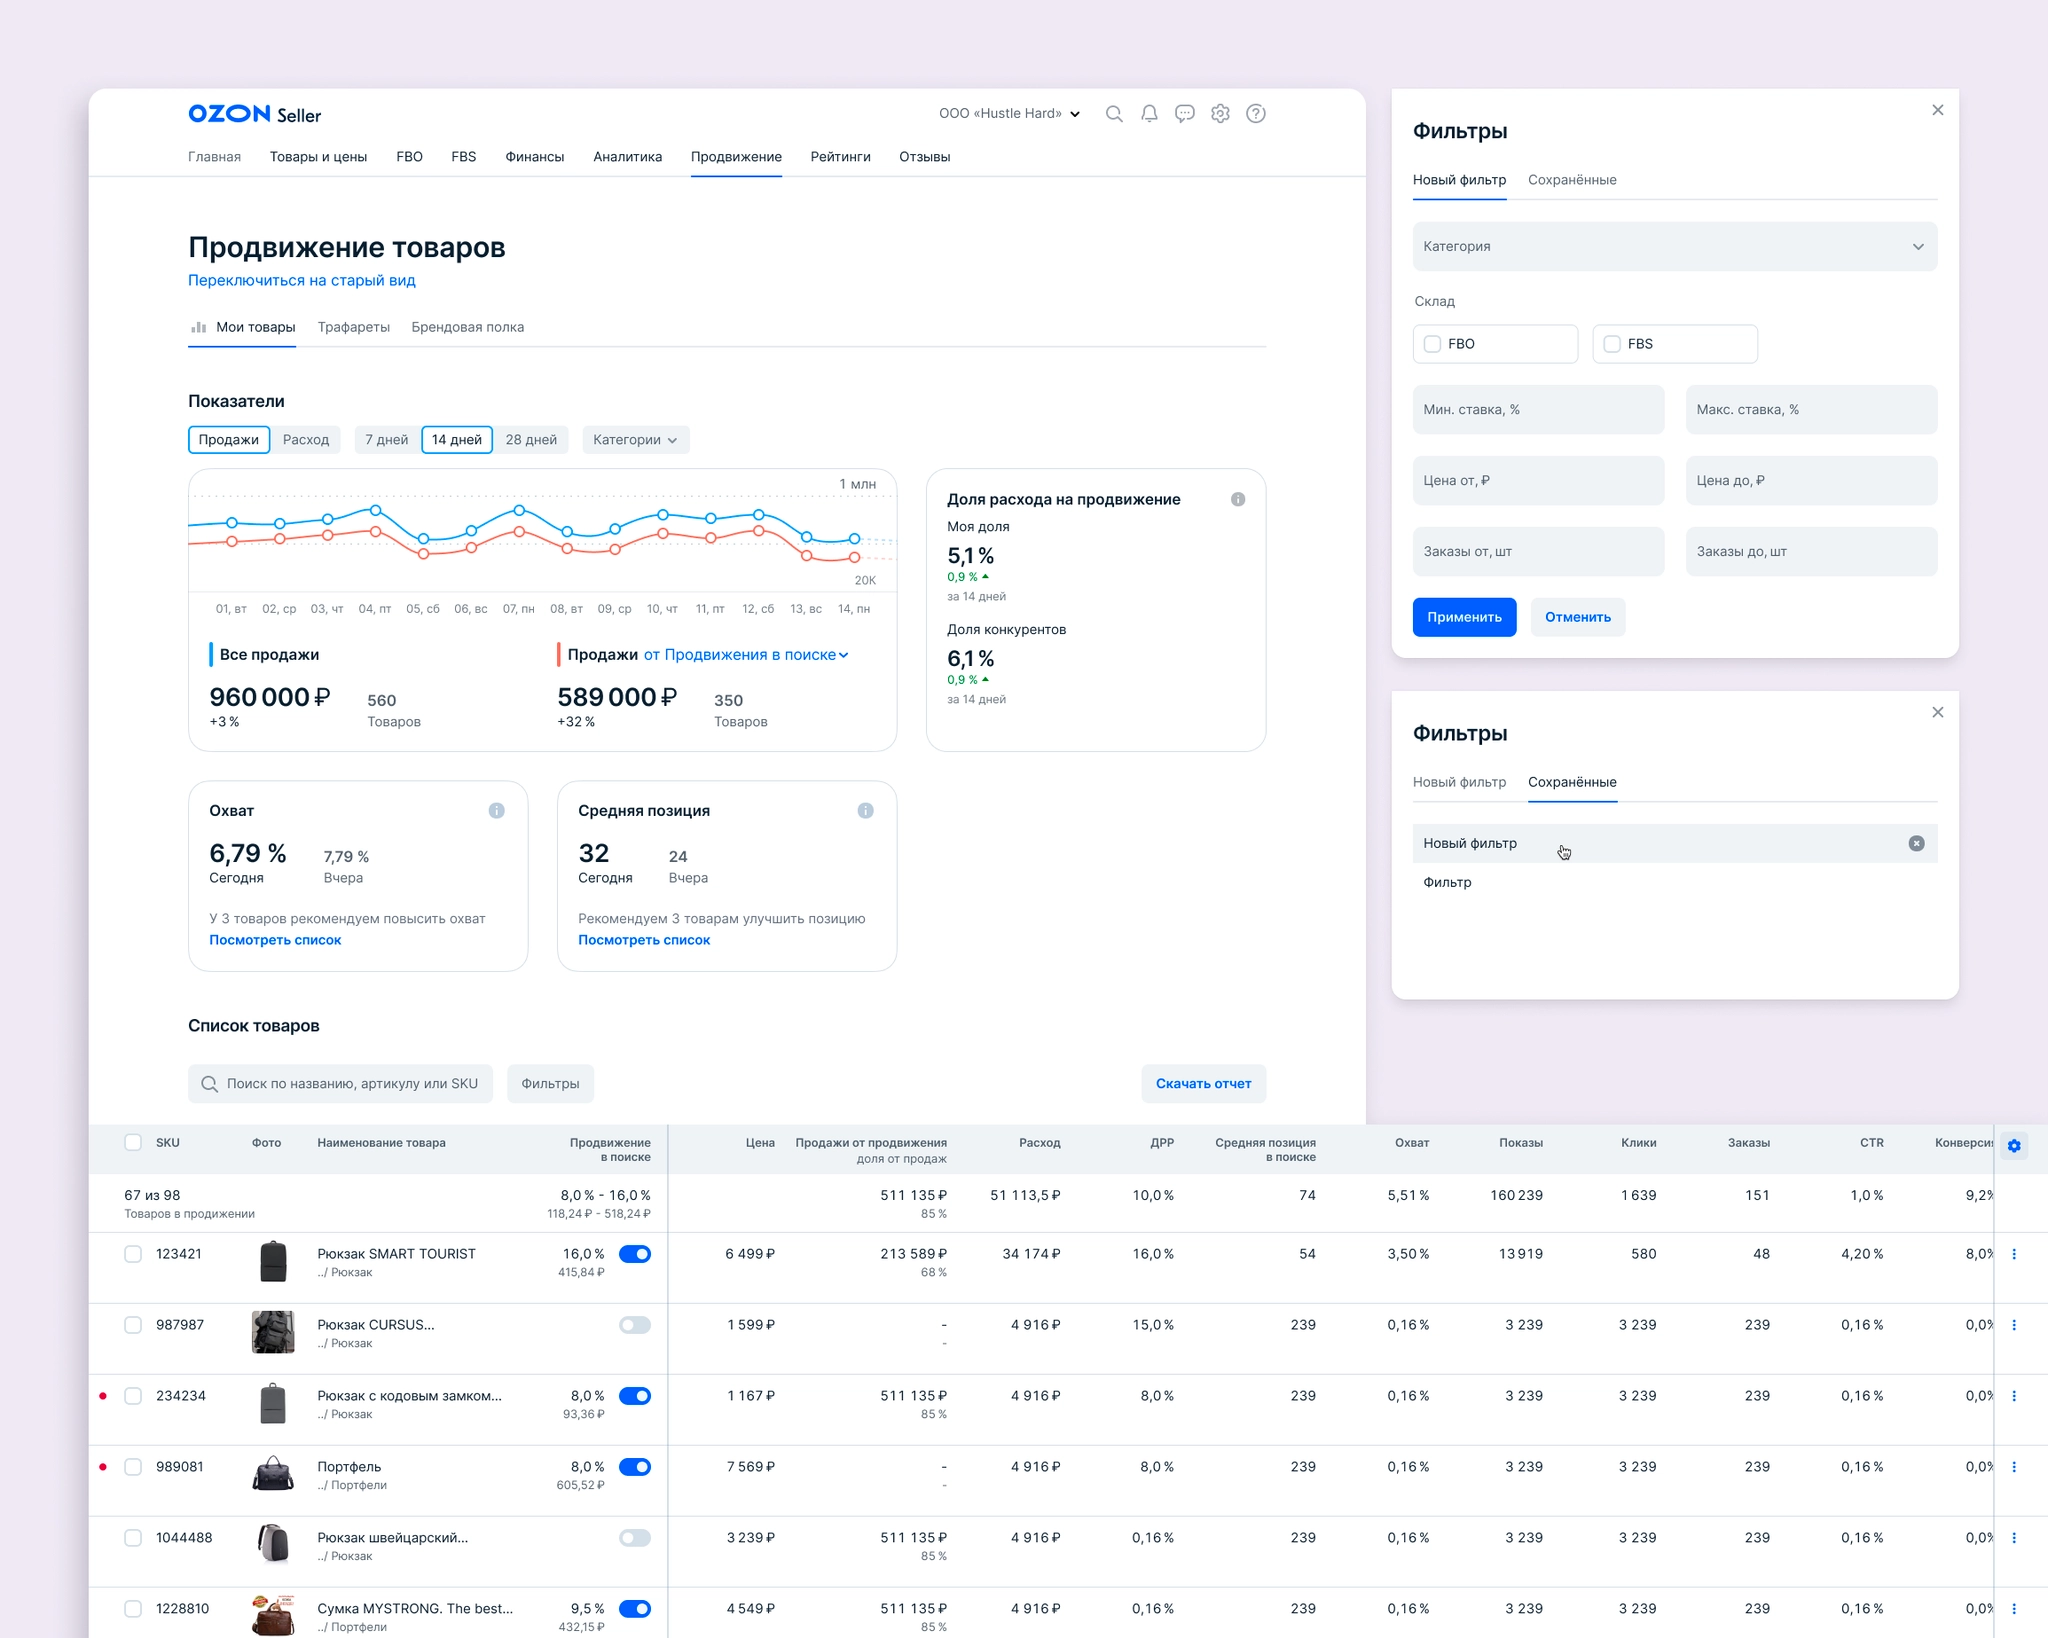
I revised the concept in response:
- Improved chart controls and removed turnover-share and conversion metrics;
- Connected recommendations to the product list and added a comparison with the previous day;
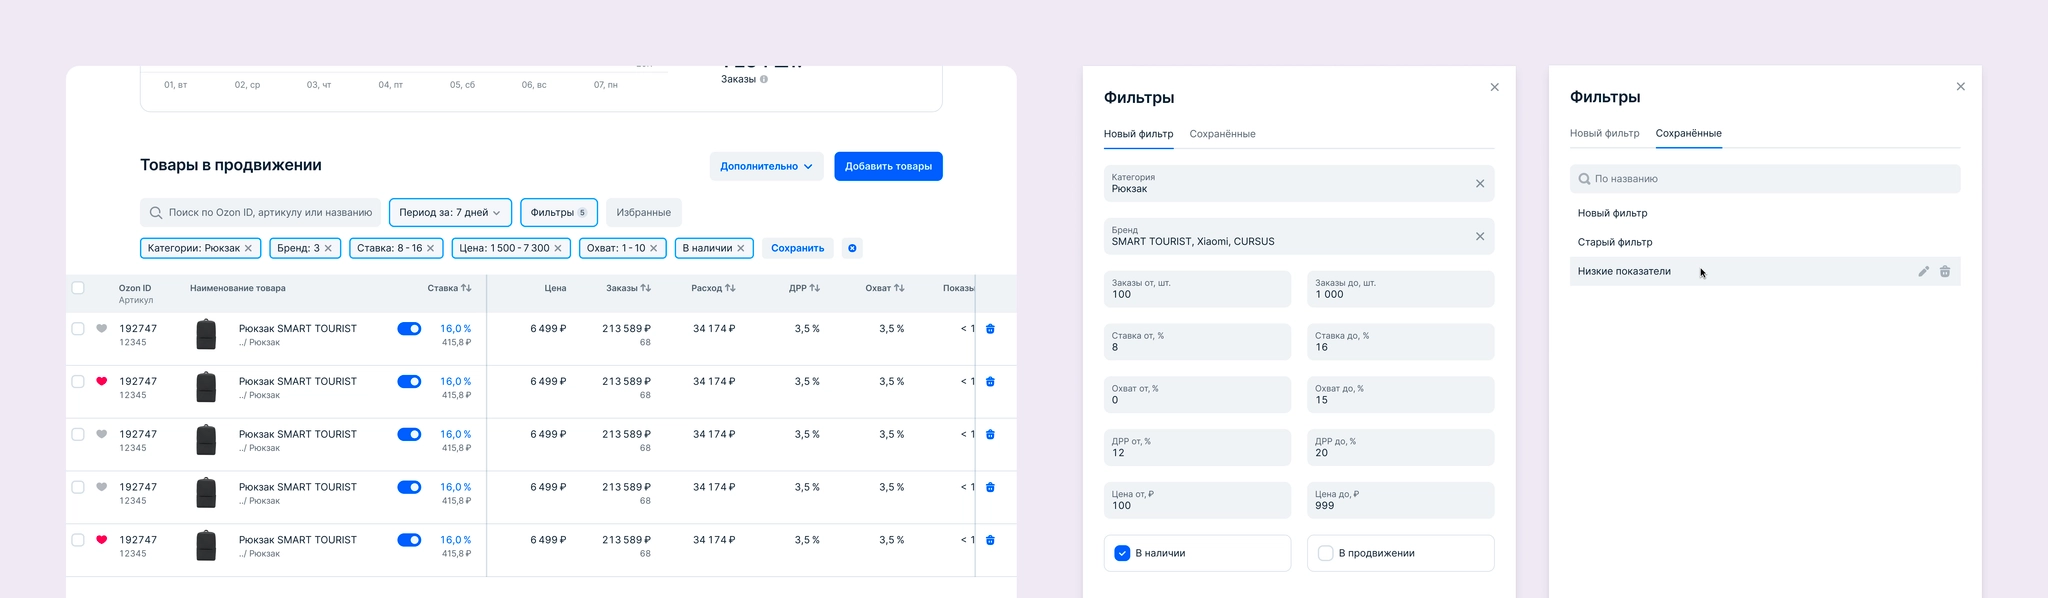
- Redesigned filters, including saving filters and managing saved lists;
- Removed Stencils actions from the product table and made room for more metrics instead.
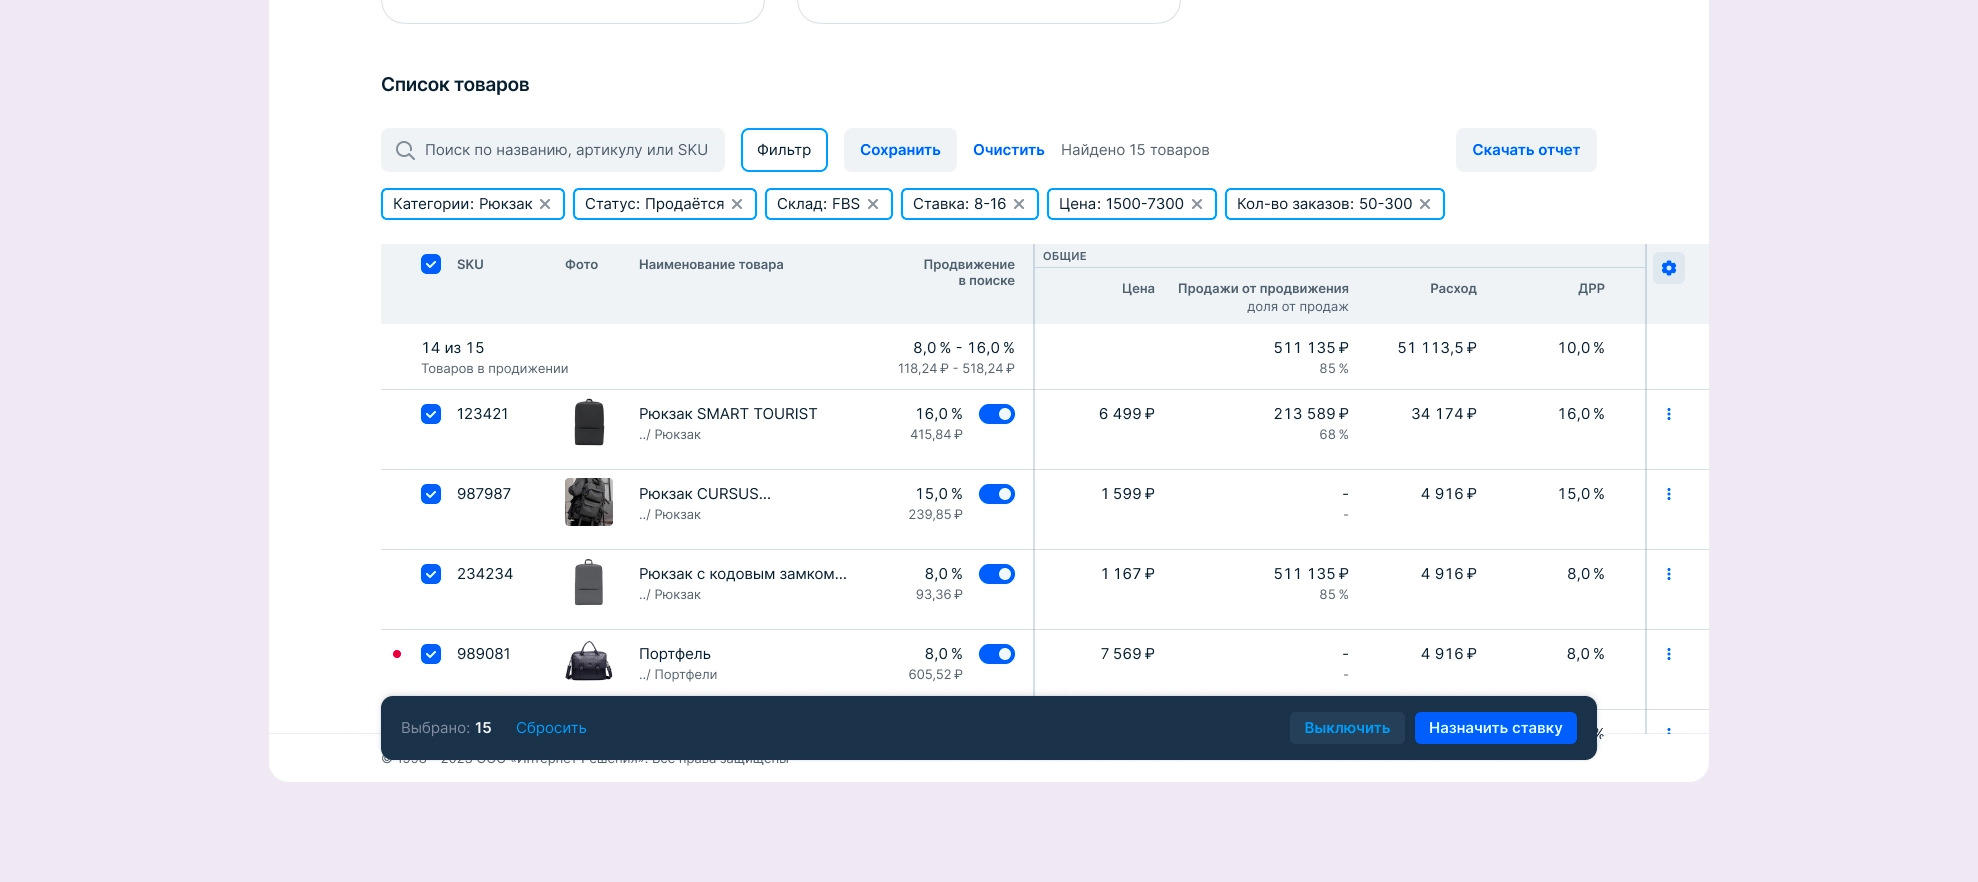
This version did not reach interviews, but developers estimated the work. The MVP had to be reduced substantially: the table was simplified, we could not immediately add all of a seller’s products to promotion, and the chart could show only sales and spend for this tool. Recommendations were also out of scope for the first release. Without per-product promotion toggles, we expected that repeatedly removing products by deleting them would remain inconvenient for sellers.
With engineering and product colleagues, we agreed on the first-release scope and a staged rollout: first 10 loyal sellers, then 500, then 3,000, and finally the rest of the initial 70% group.
For the MVP, I designed:
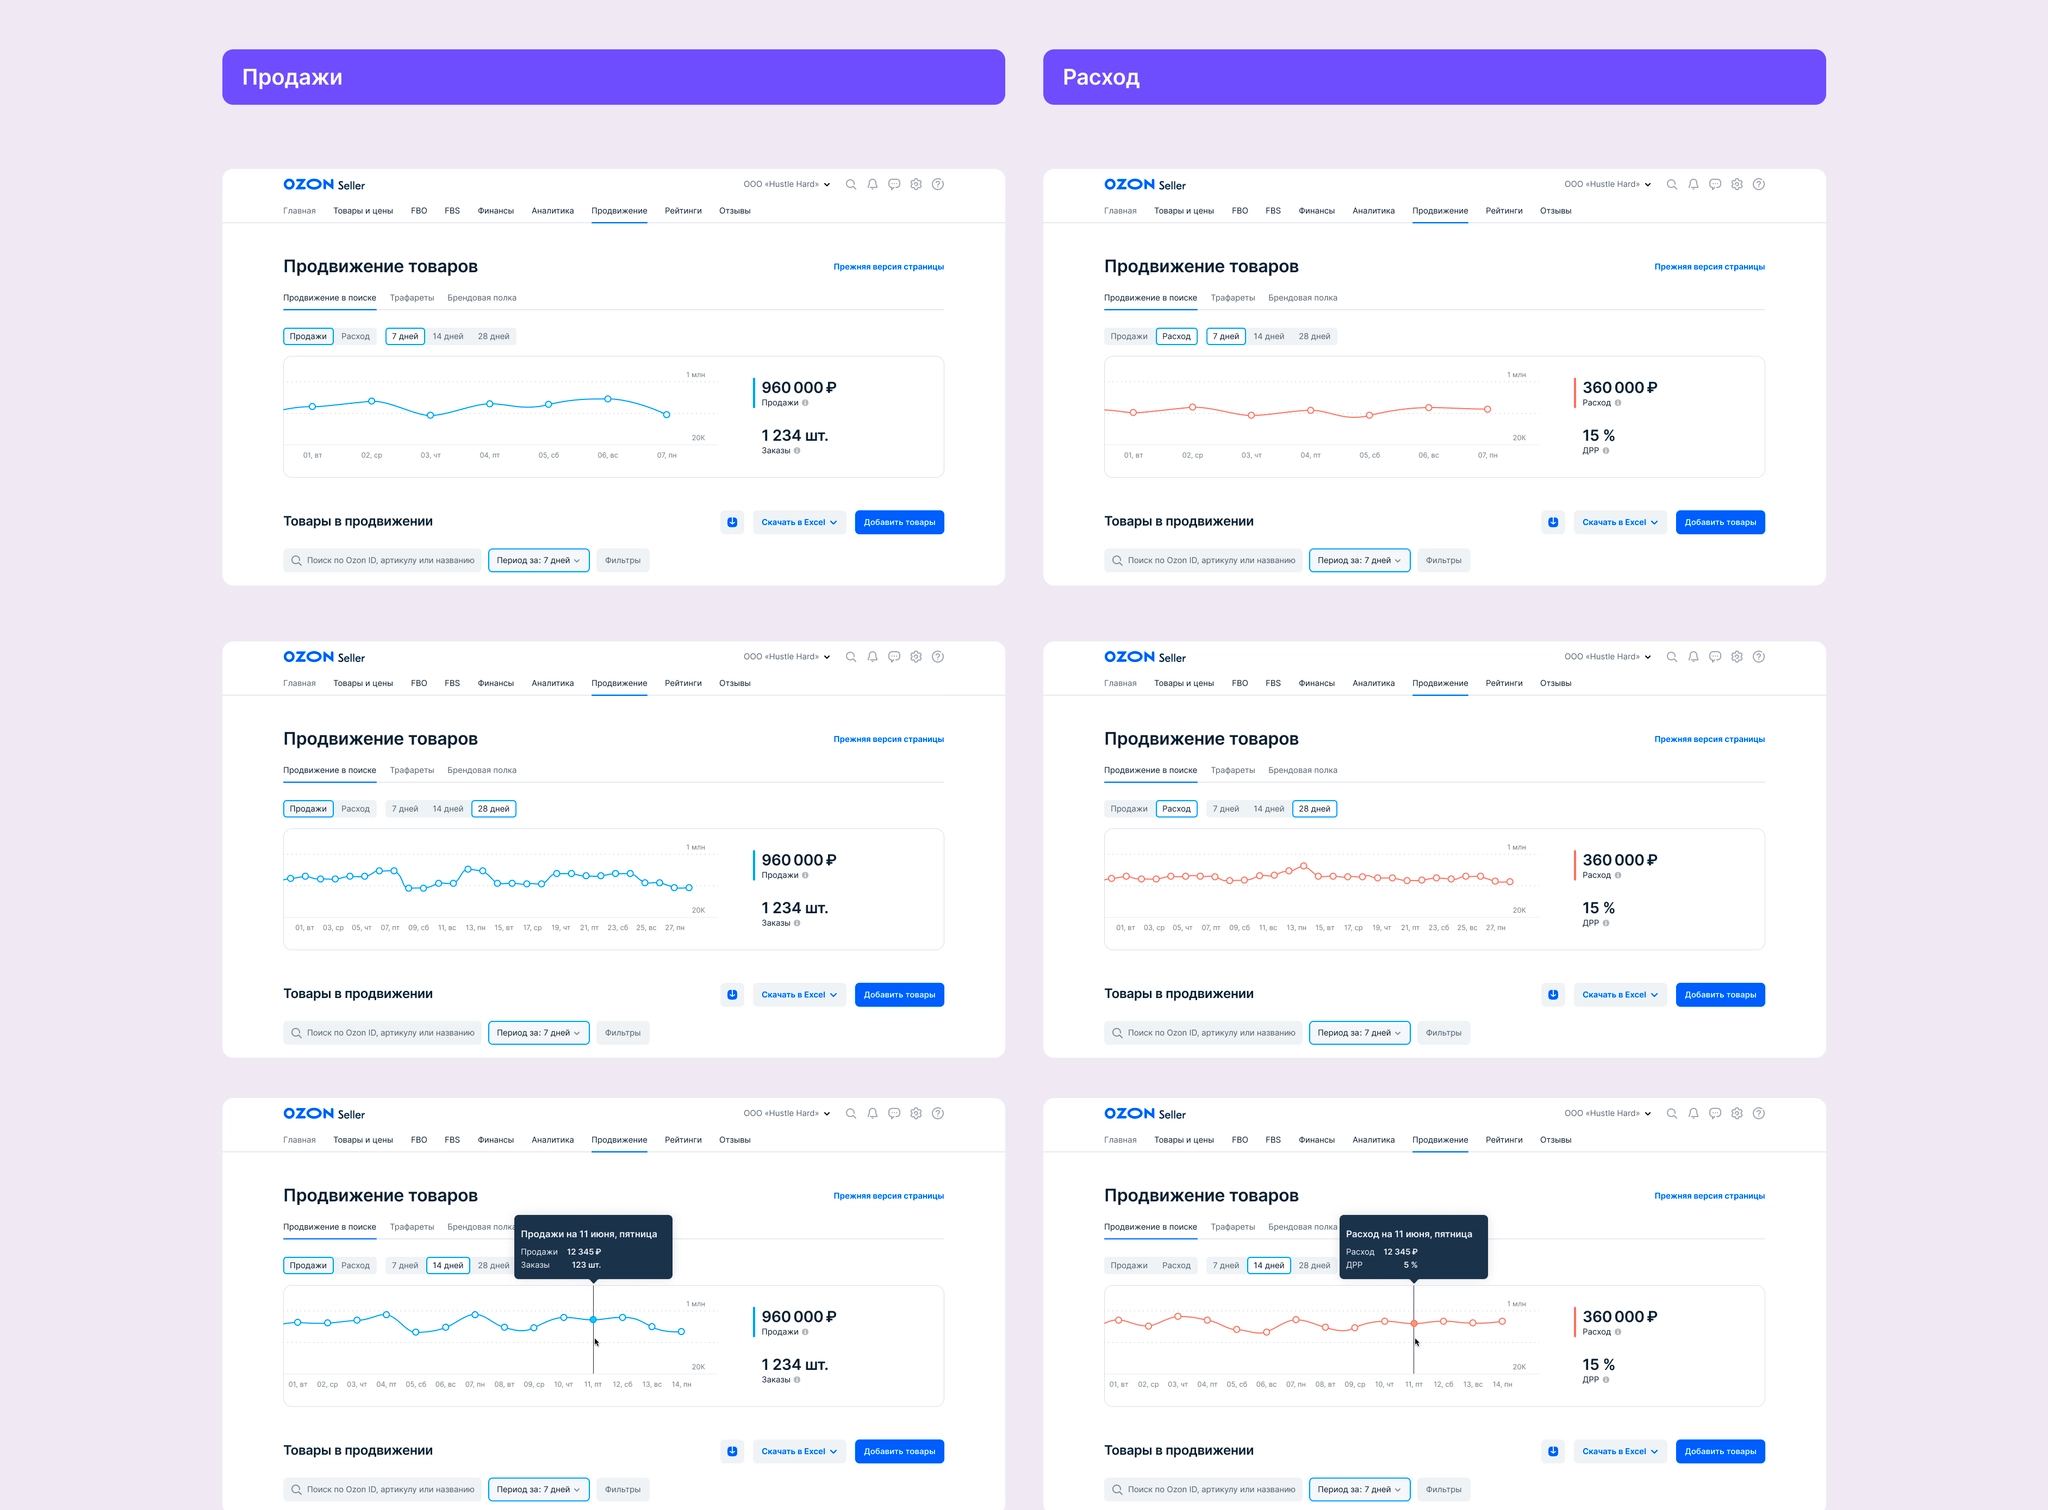
Charts showing sales, spend, and related metrics only.
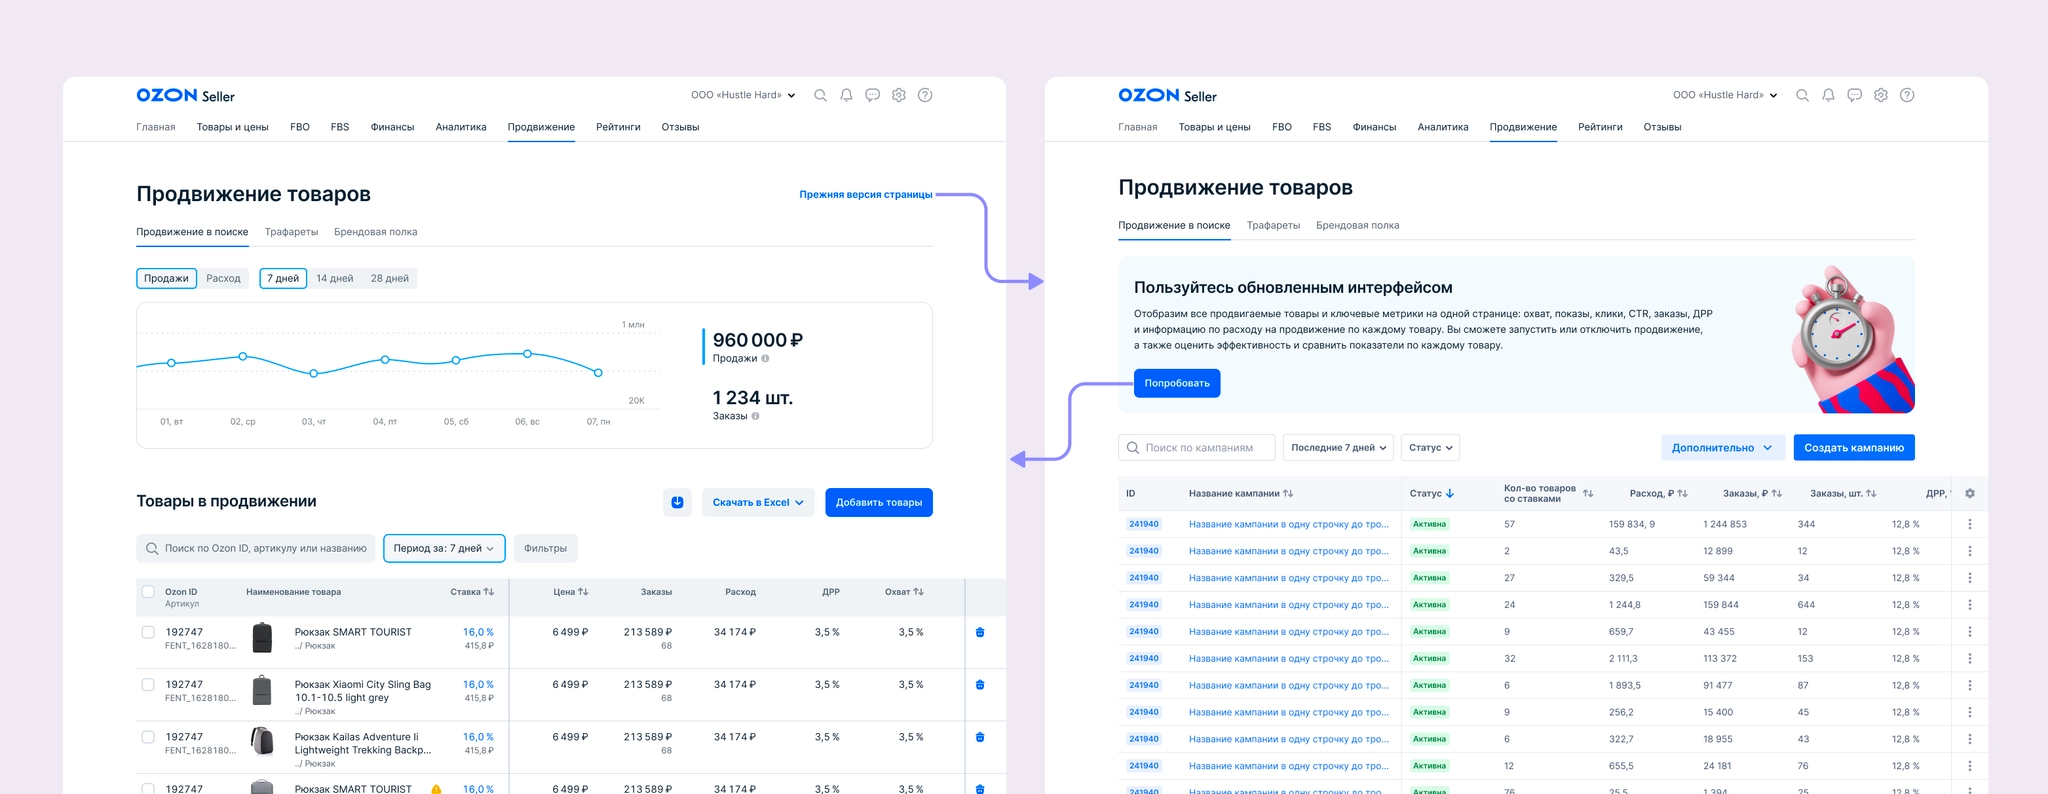
States for moving between the old and new interfaces.
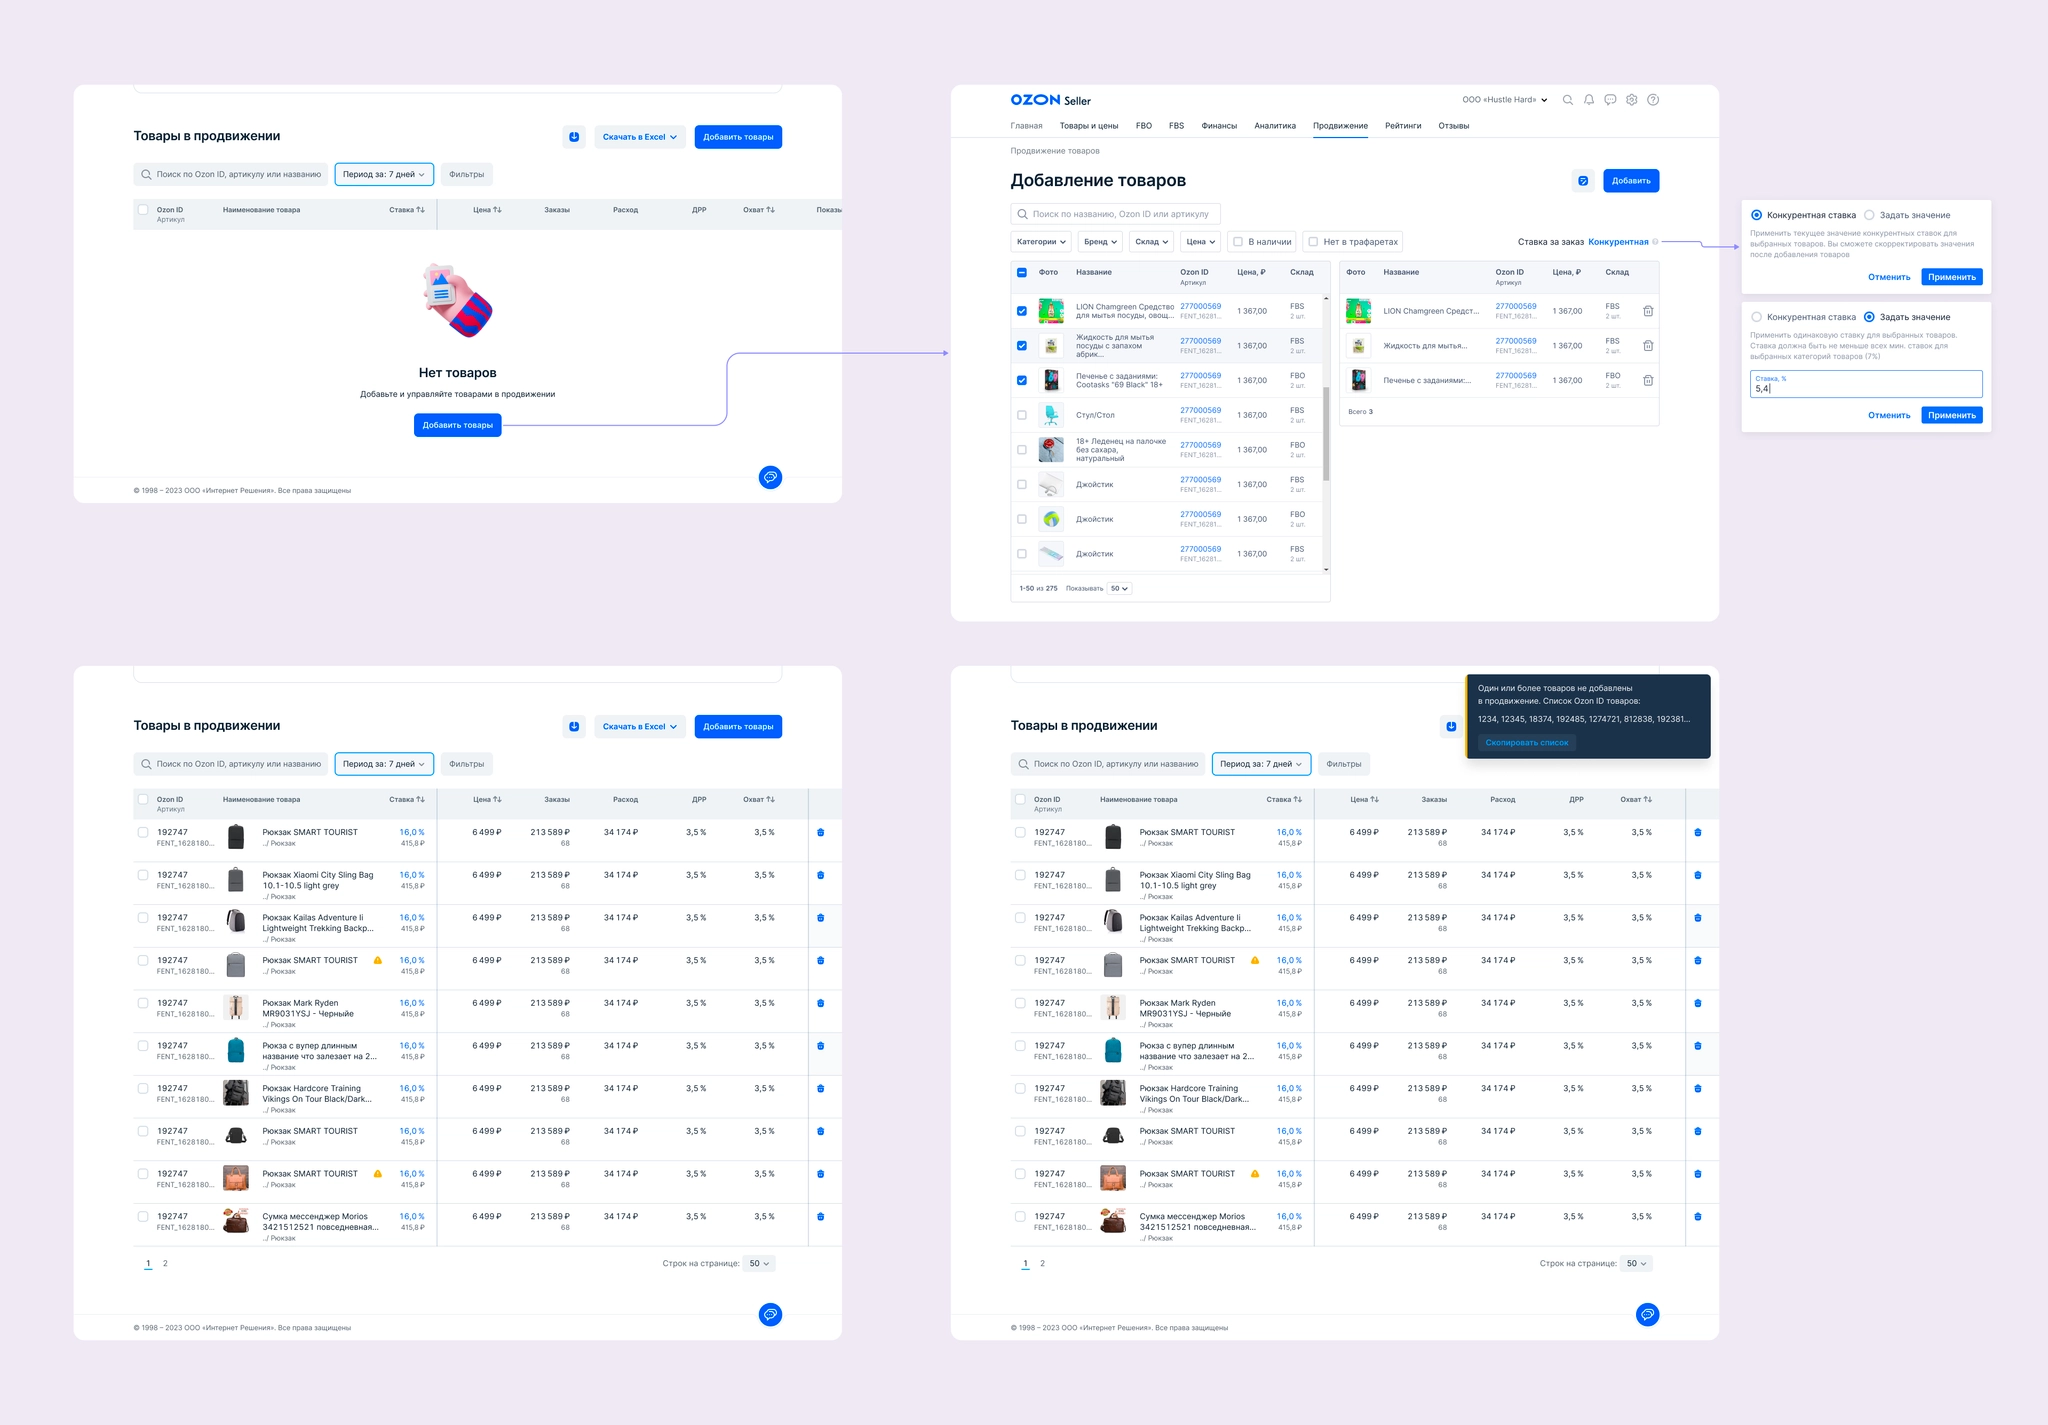
Empty states, the product-addition flow, and an error state for products that could not be added.
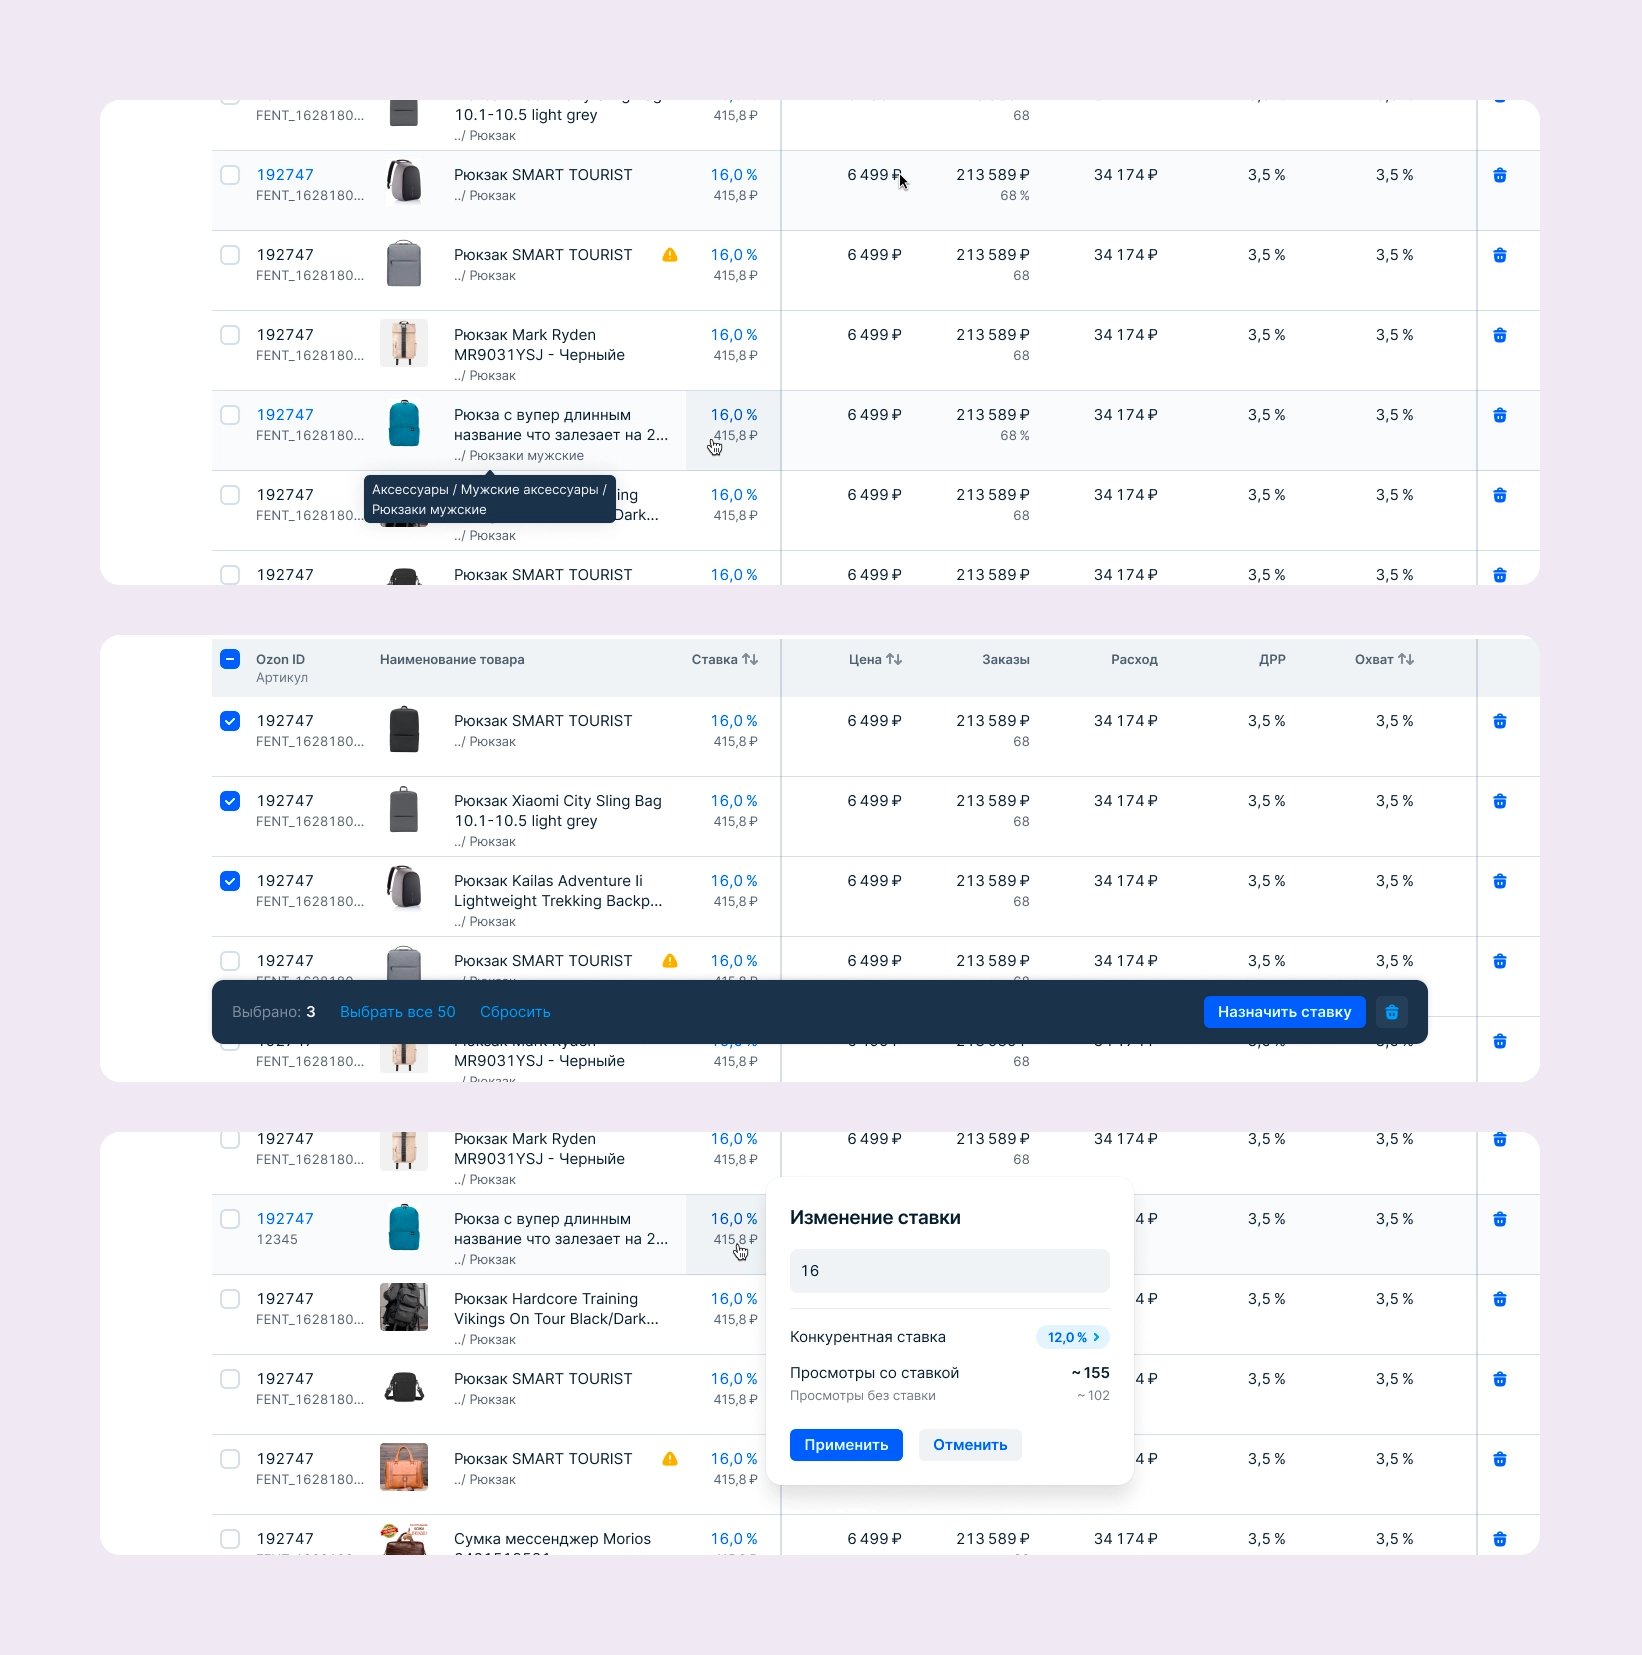
The table, including row and cell behavior. I added product categories next to names, a frequent request in quantitative research. I also designed bulk actions, with room to expand bulk settings later.
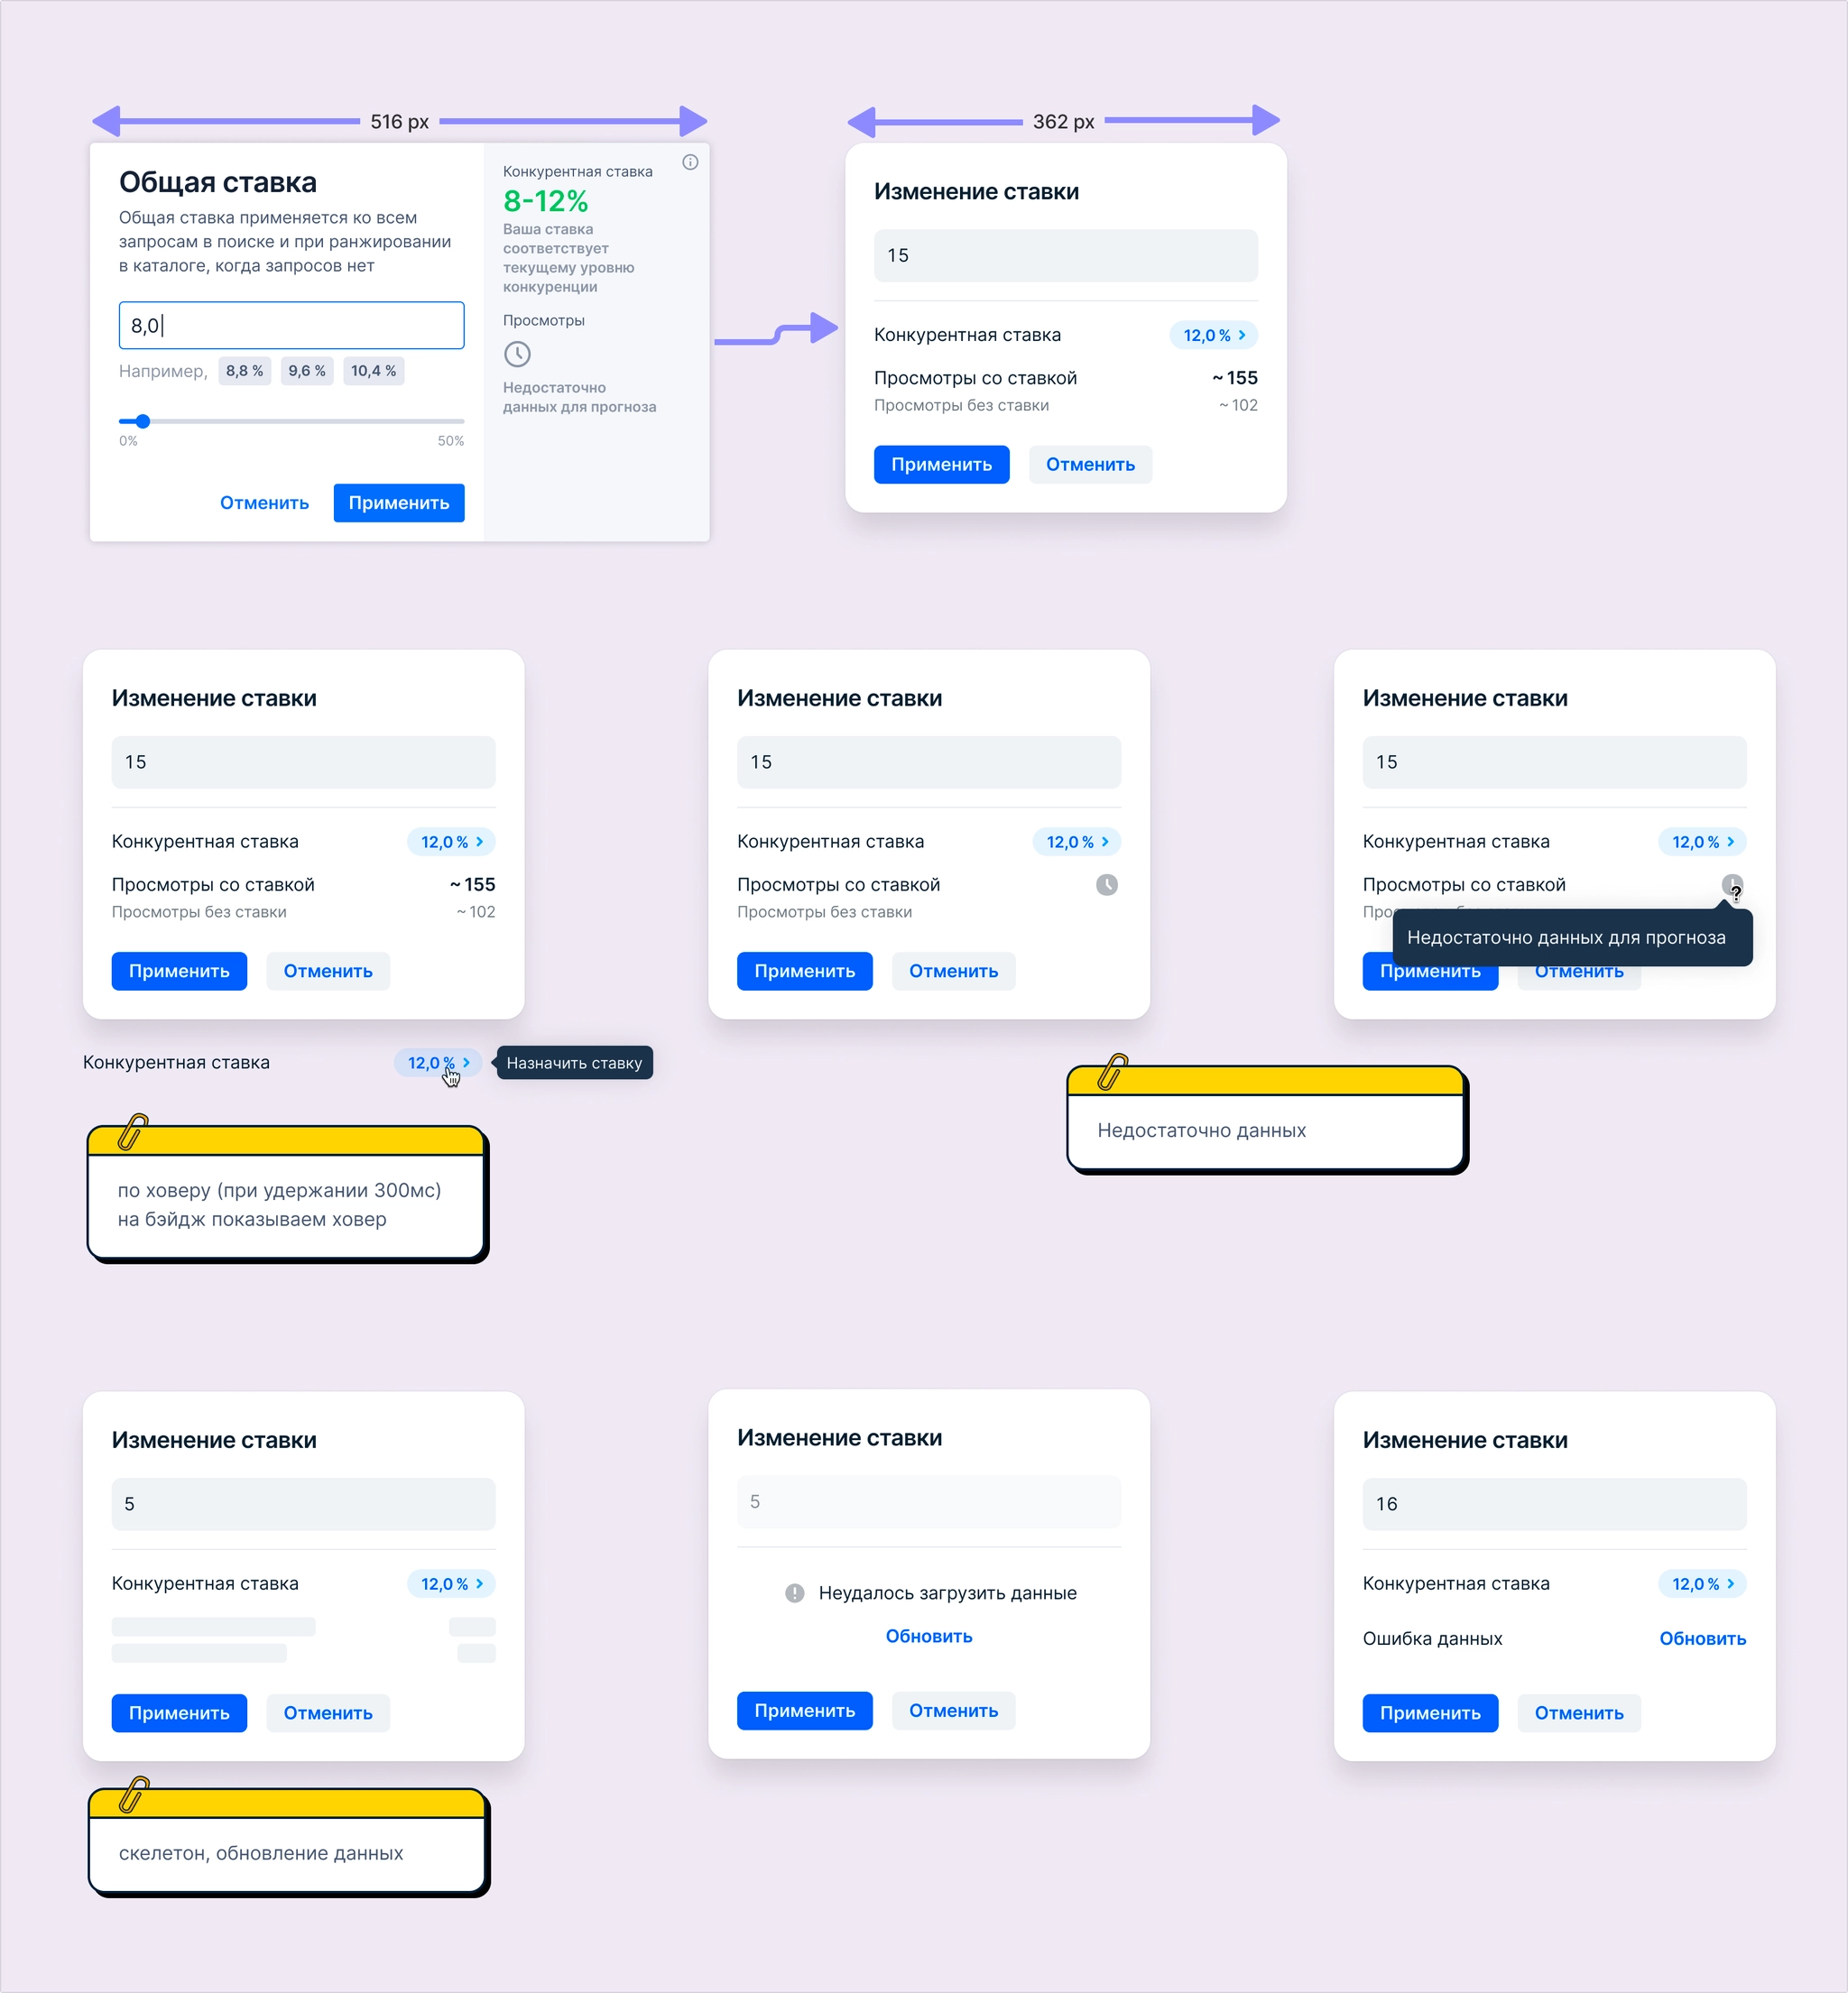
An updated, simpler bid editor that took less space while presenting information more compactly.
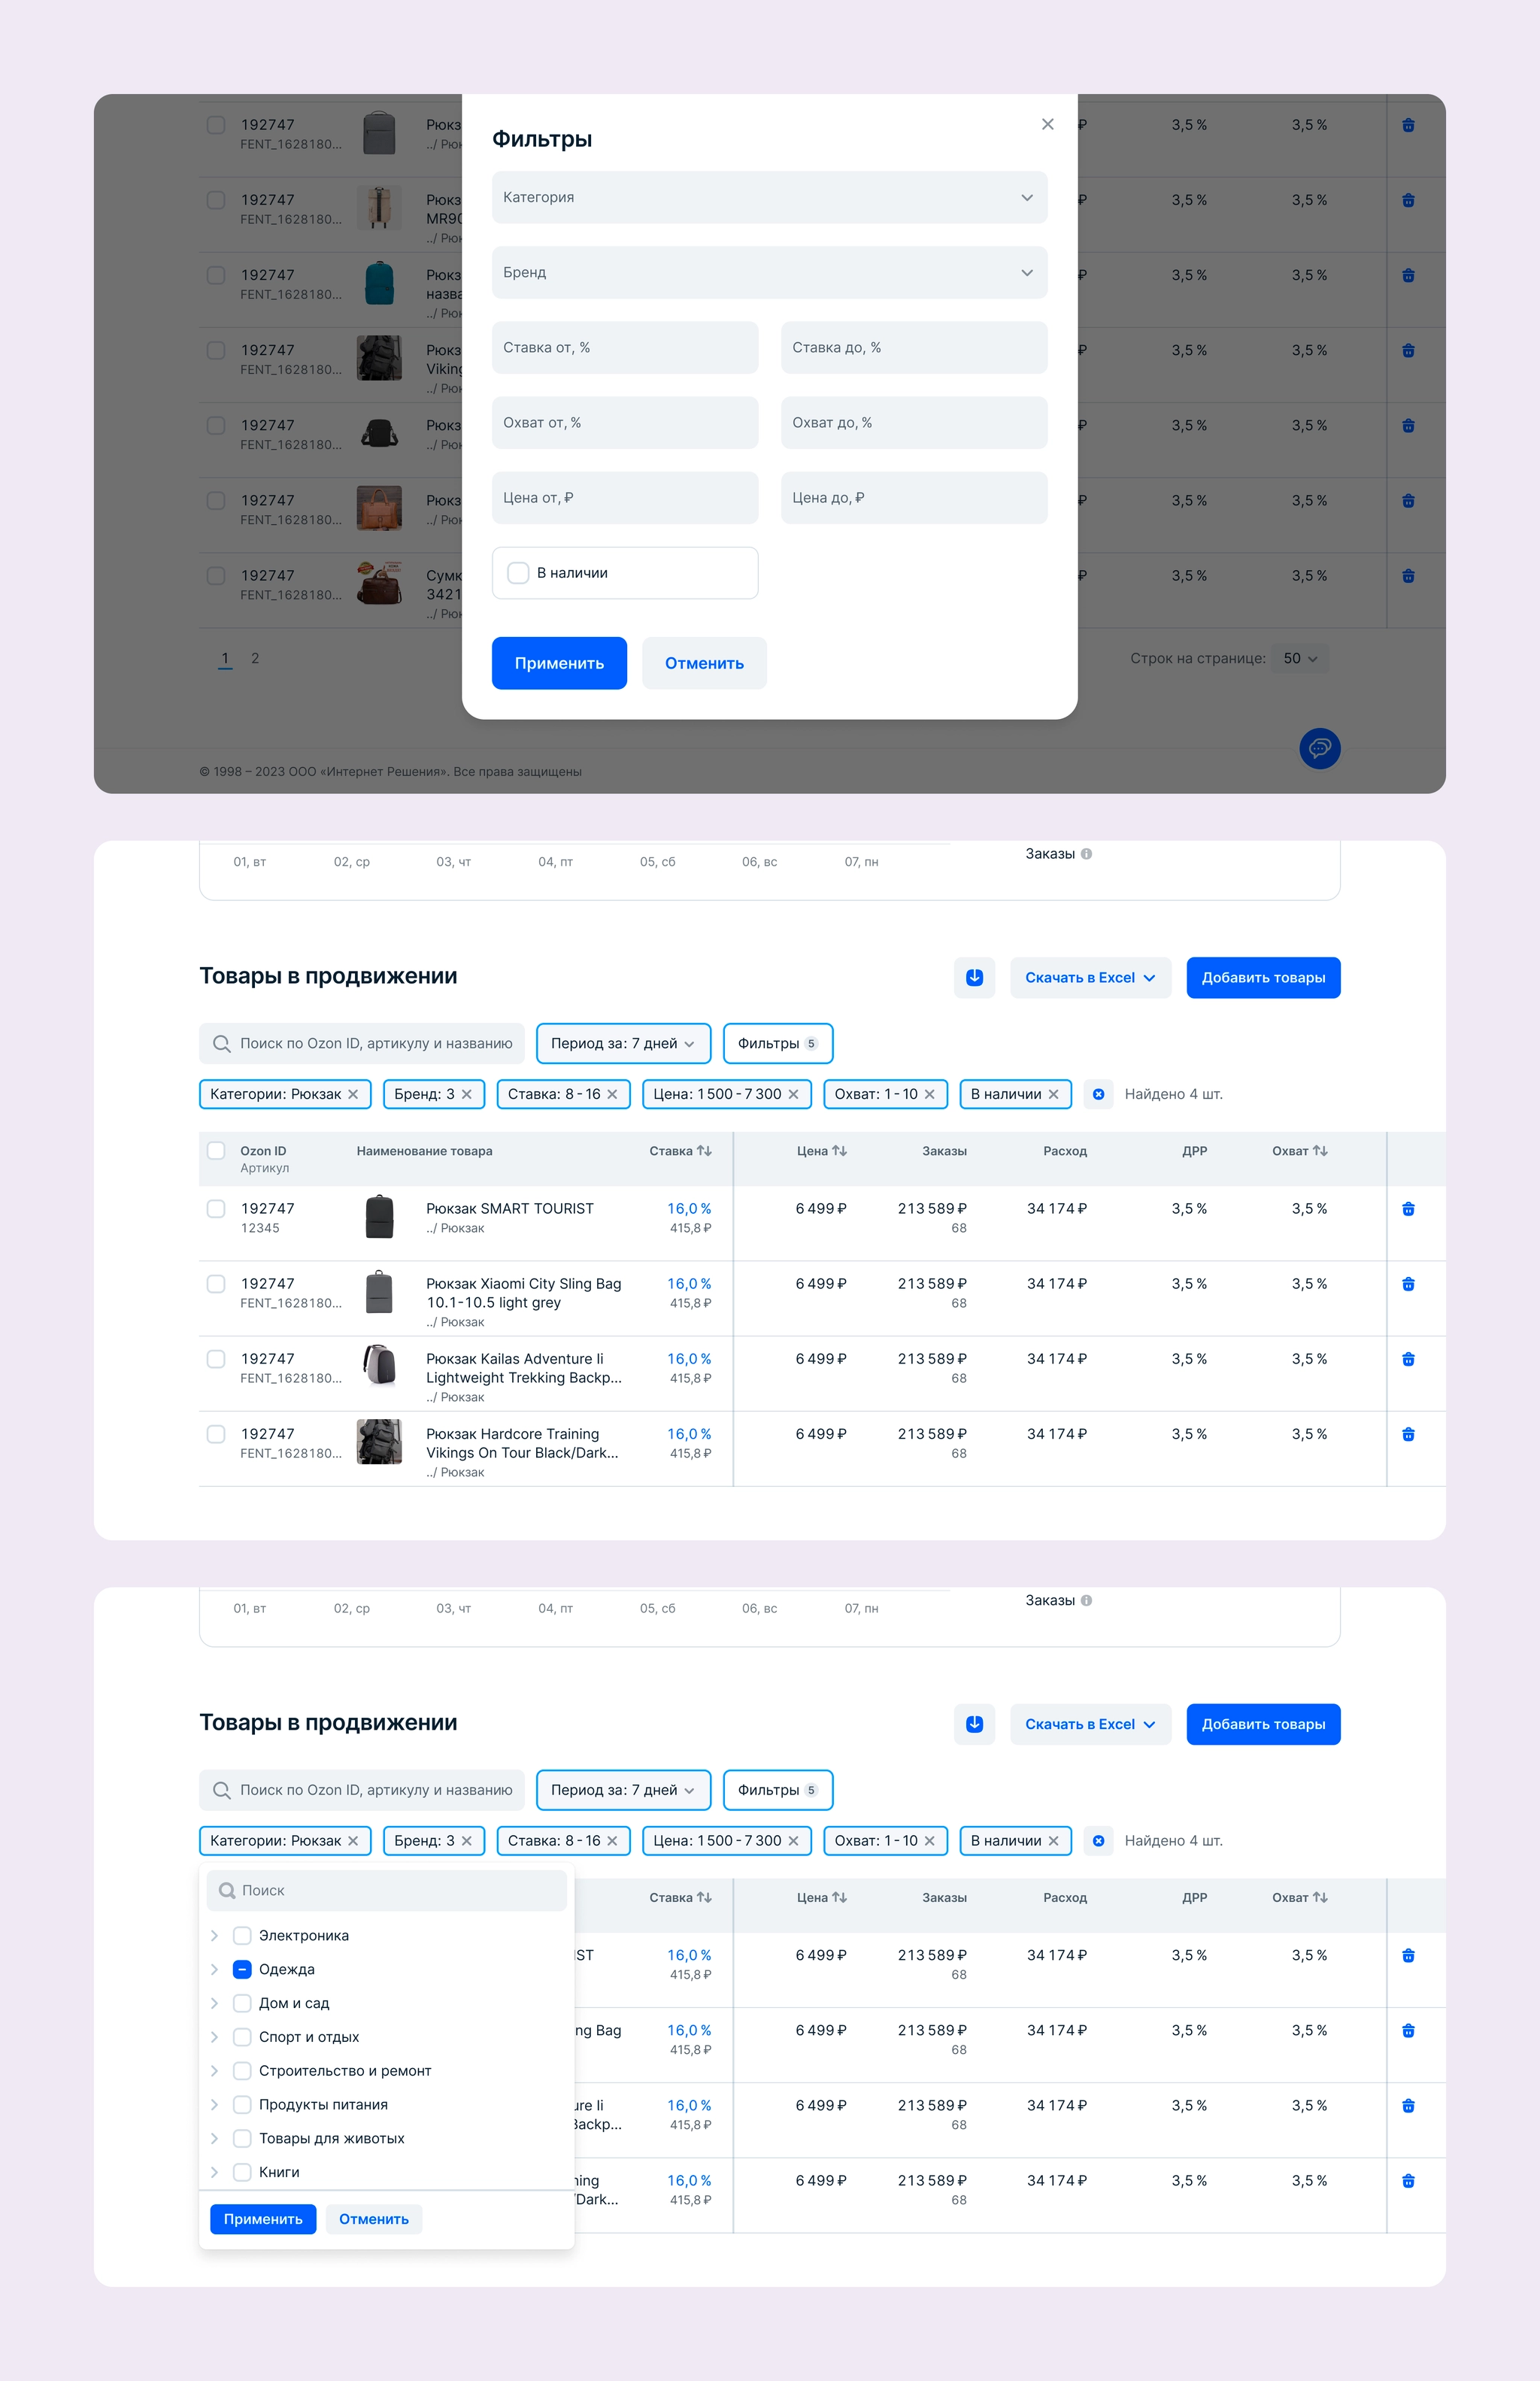
Filters. With a potentially large product catalog, processing every filter change on the backend would be difficult, so filters are configured in a modal. The number of filters can grow as the tool develops. Usage data could later show which filters should be moved above the table for quicker access.
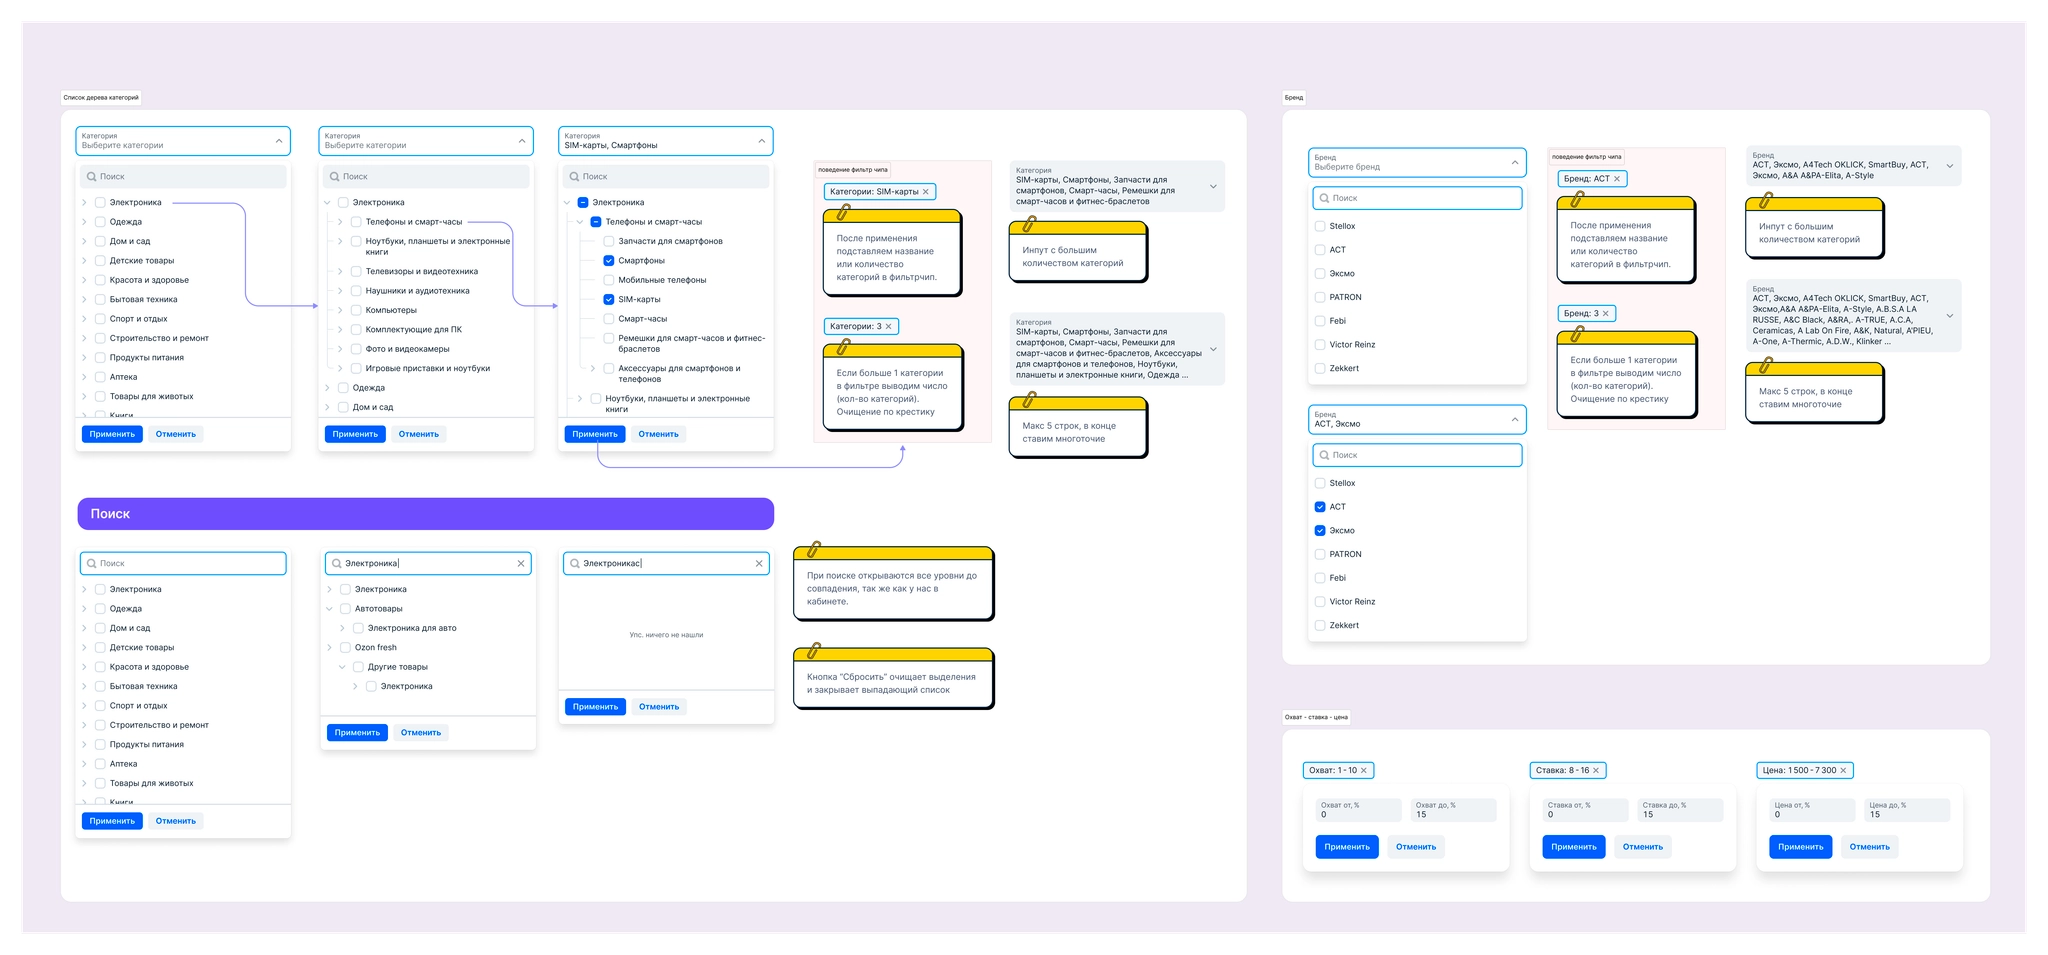
I documented the behavior of nearly every filter setting, both in the modal and above the table, for developers.
The report flow. Reports are generated asynchronously in two formats, so users need a page listing generated reports and their statuses.
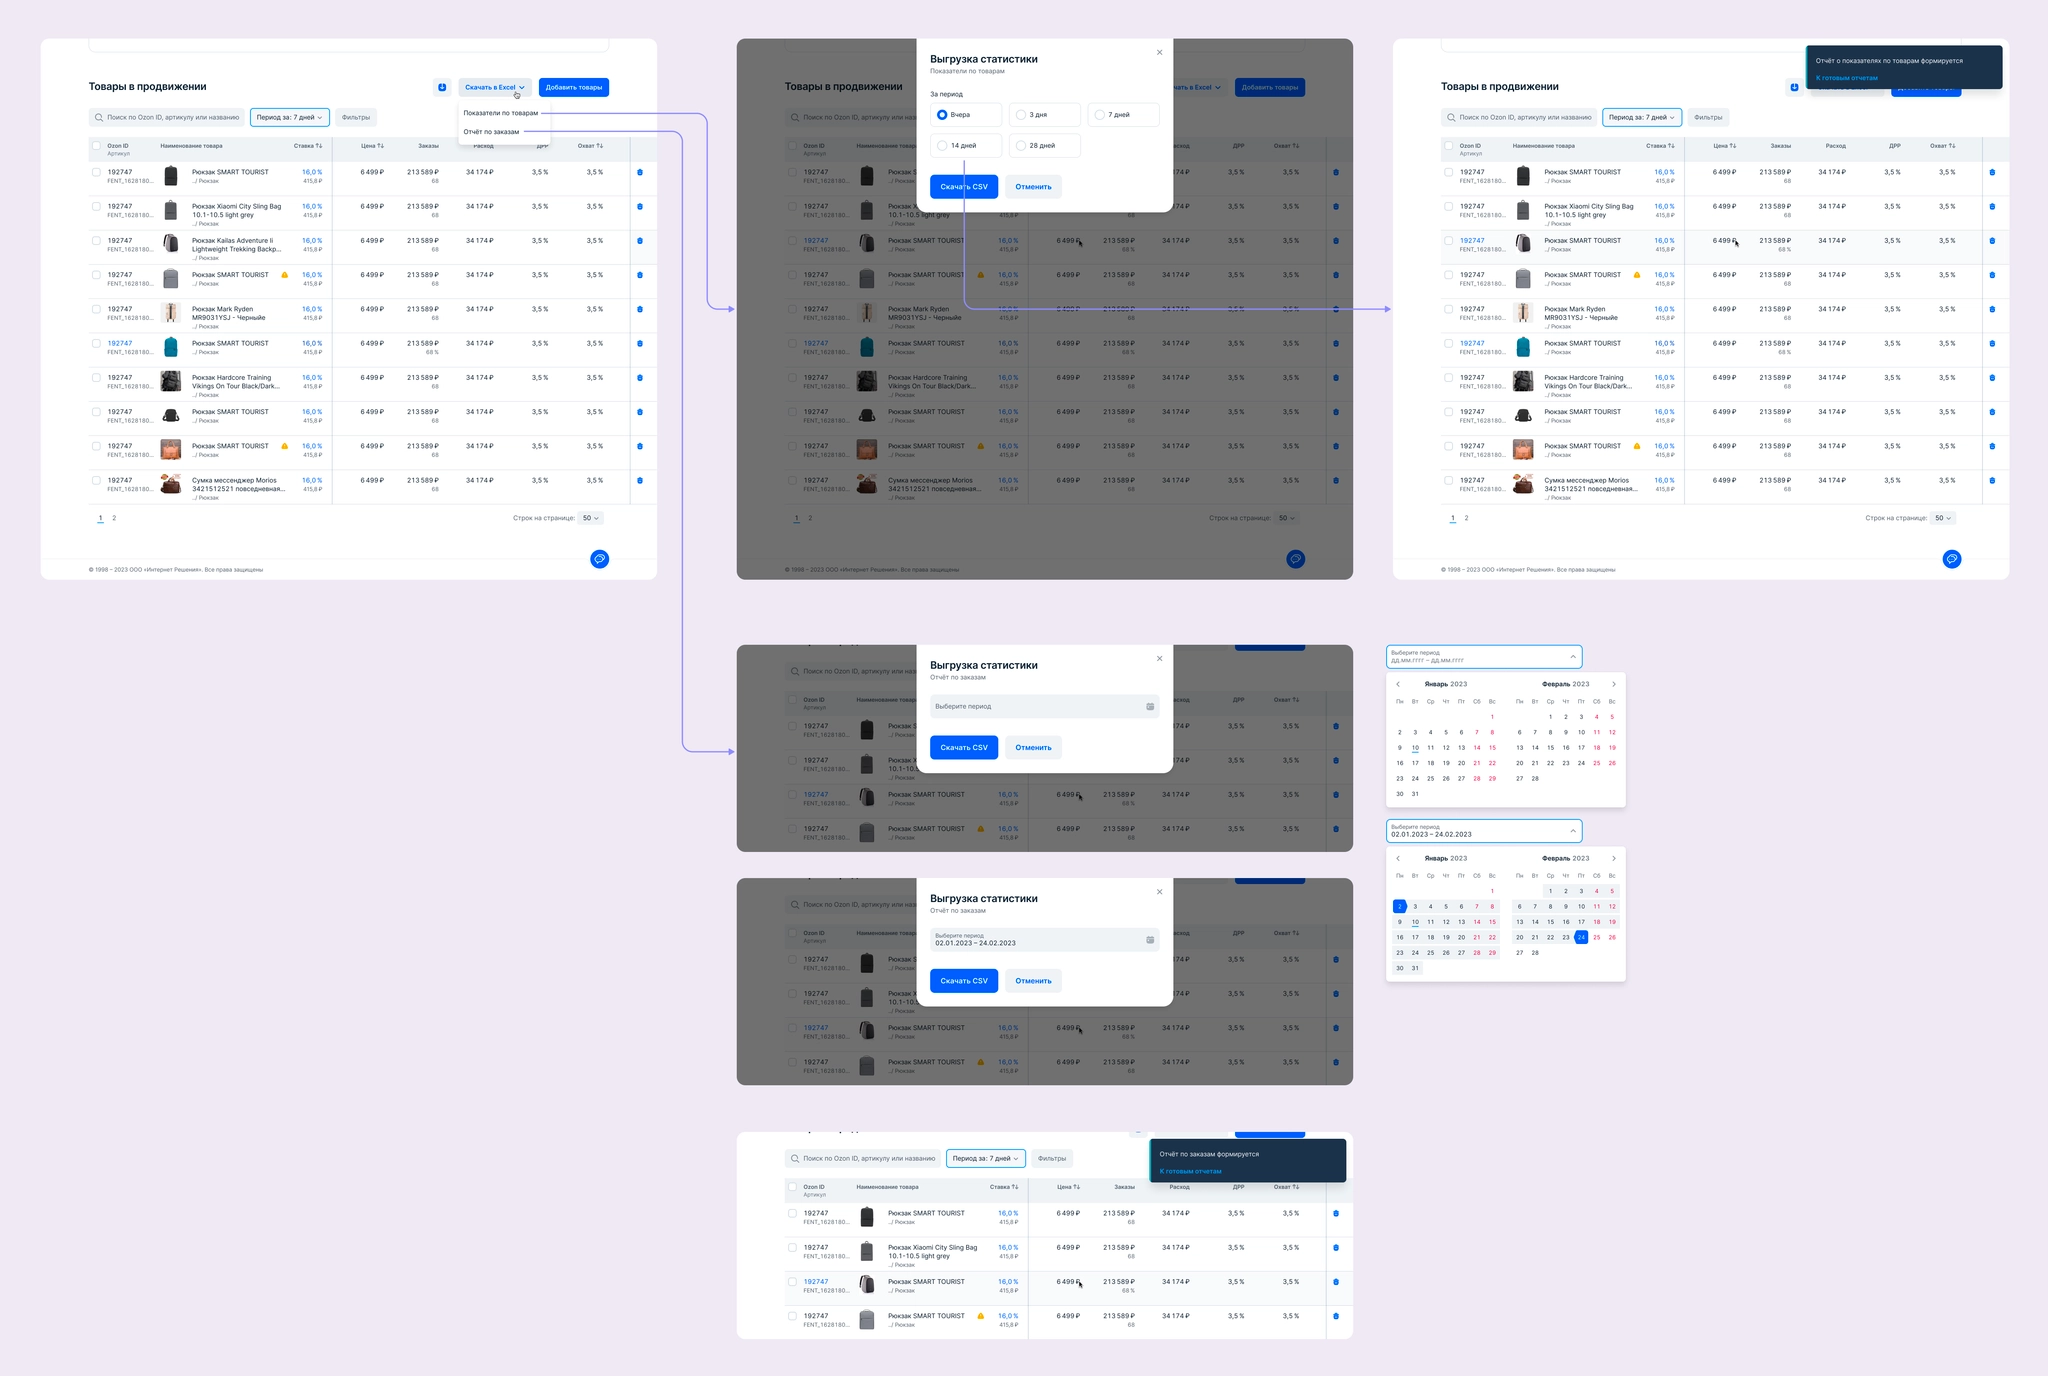
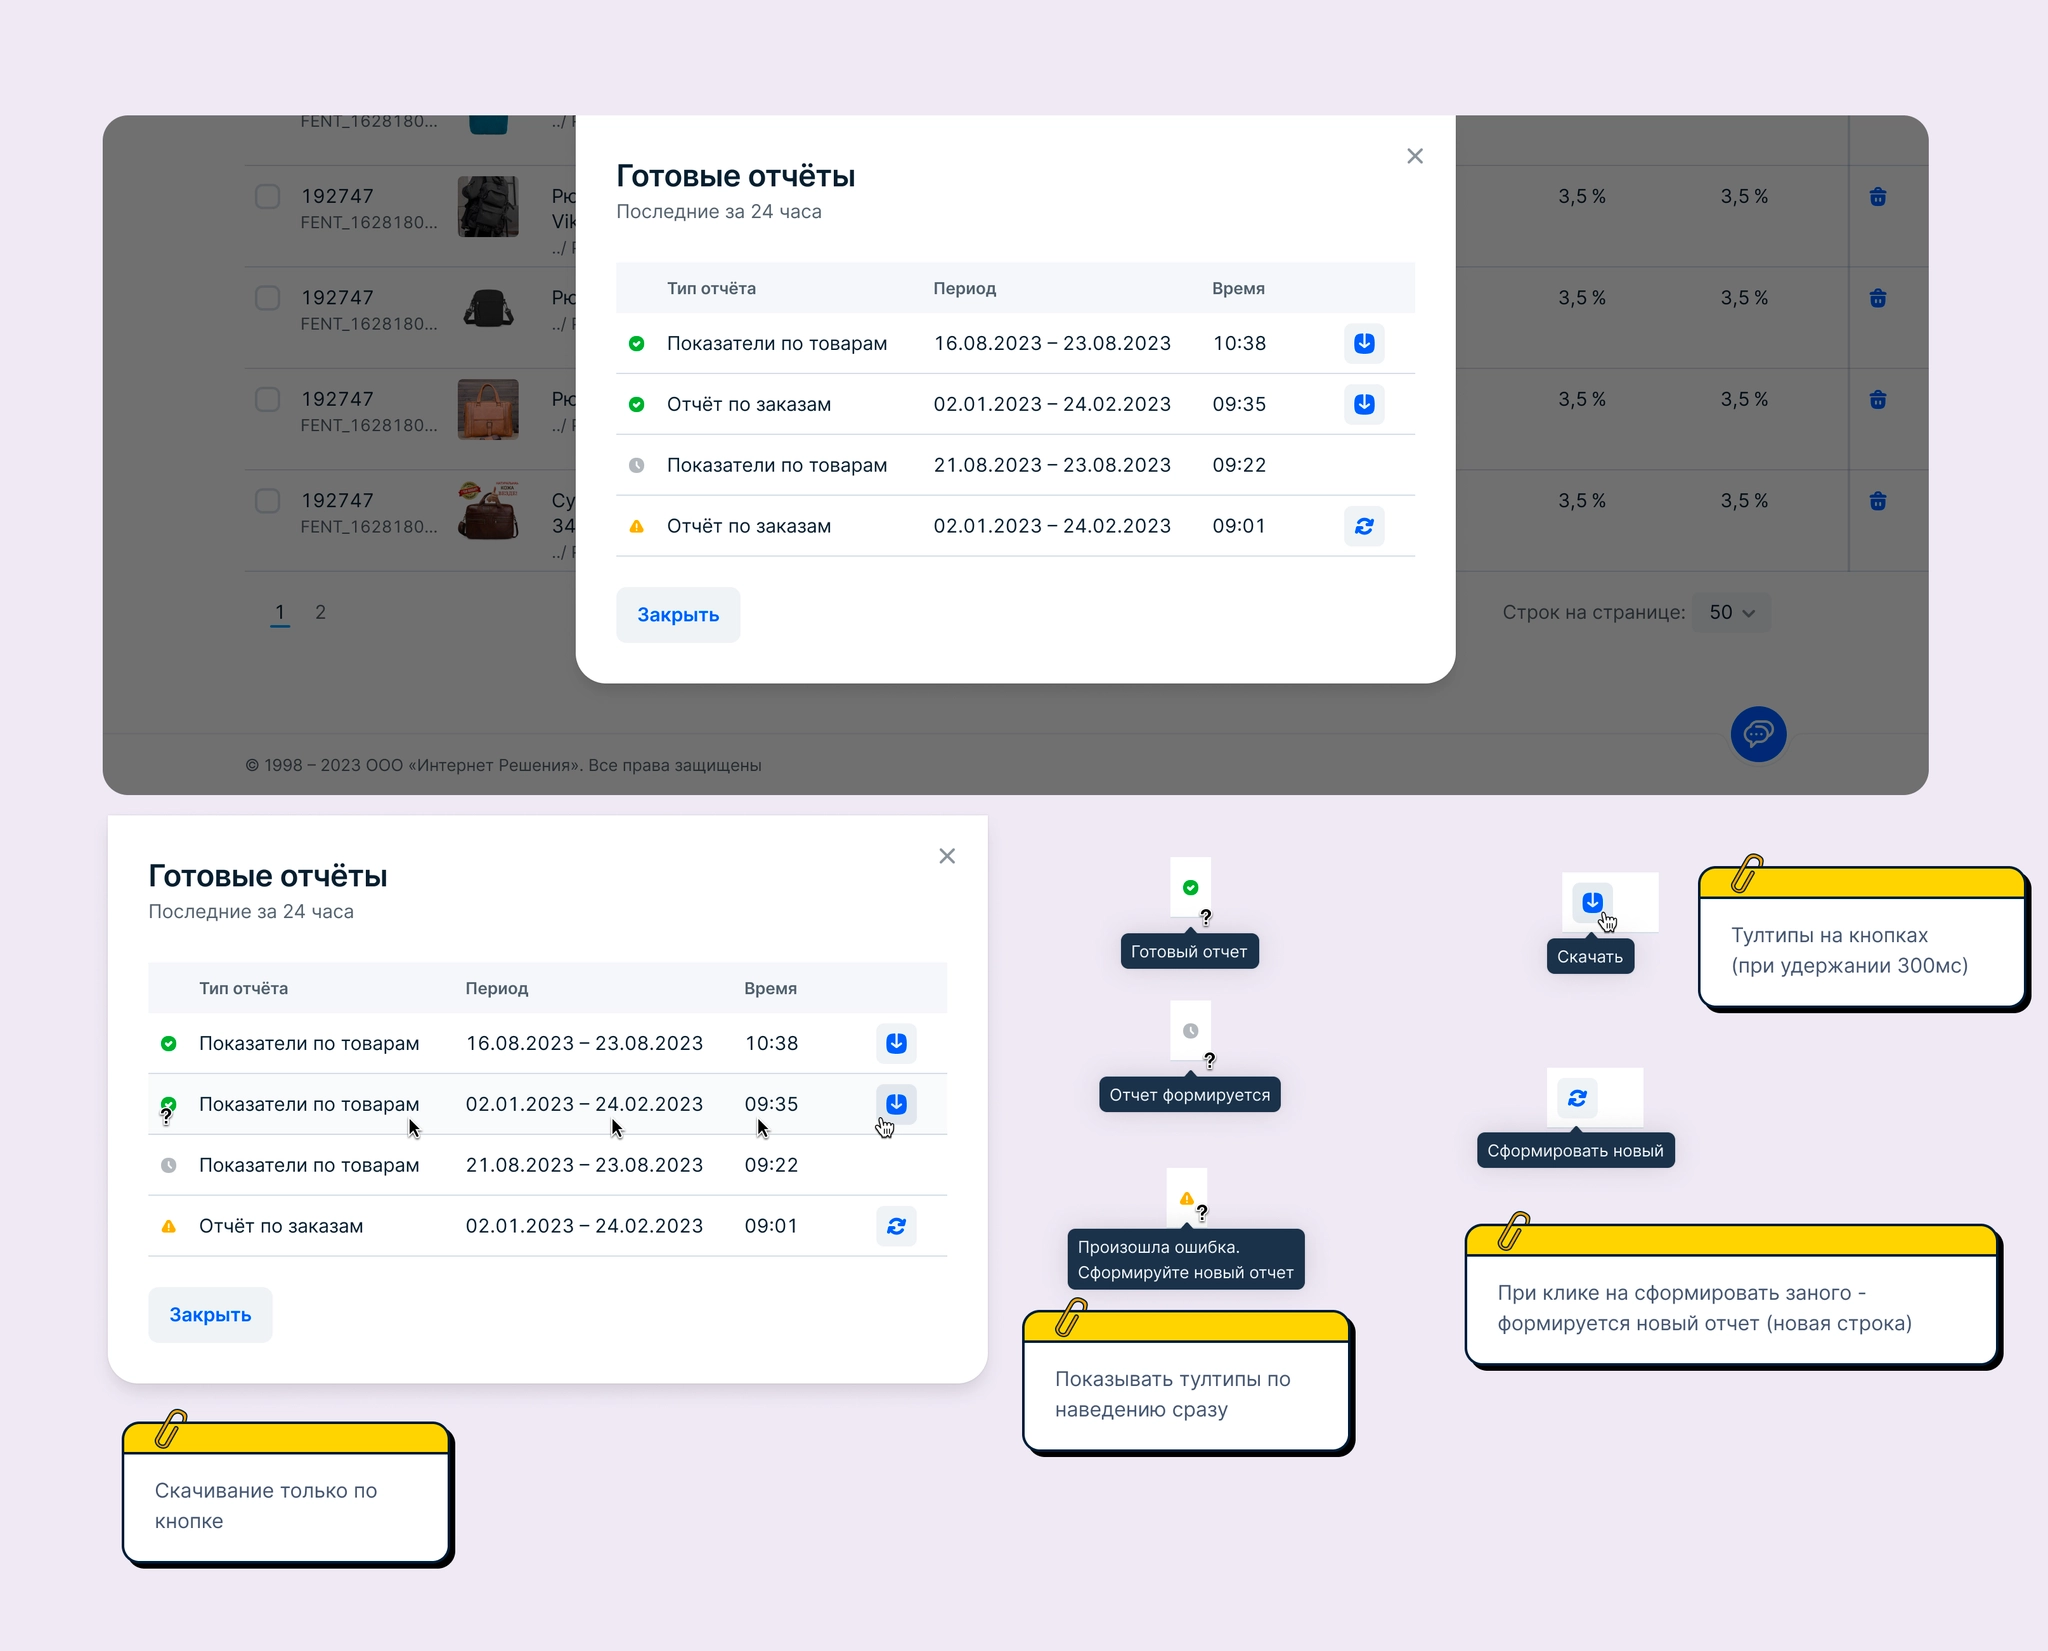
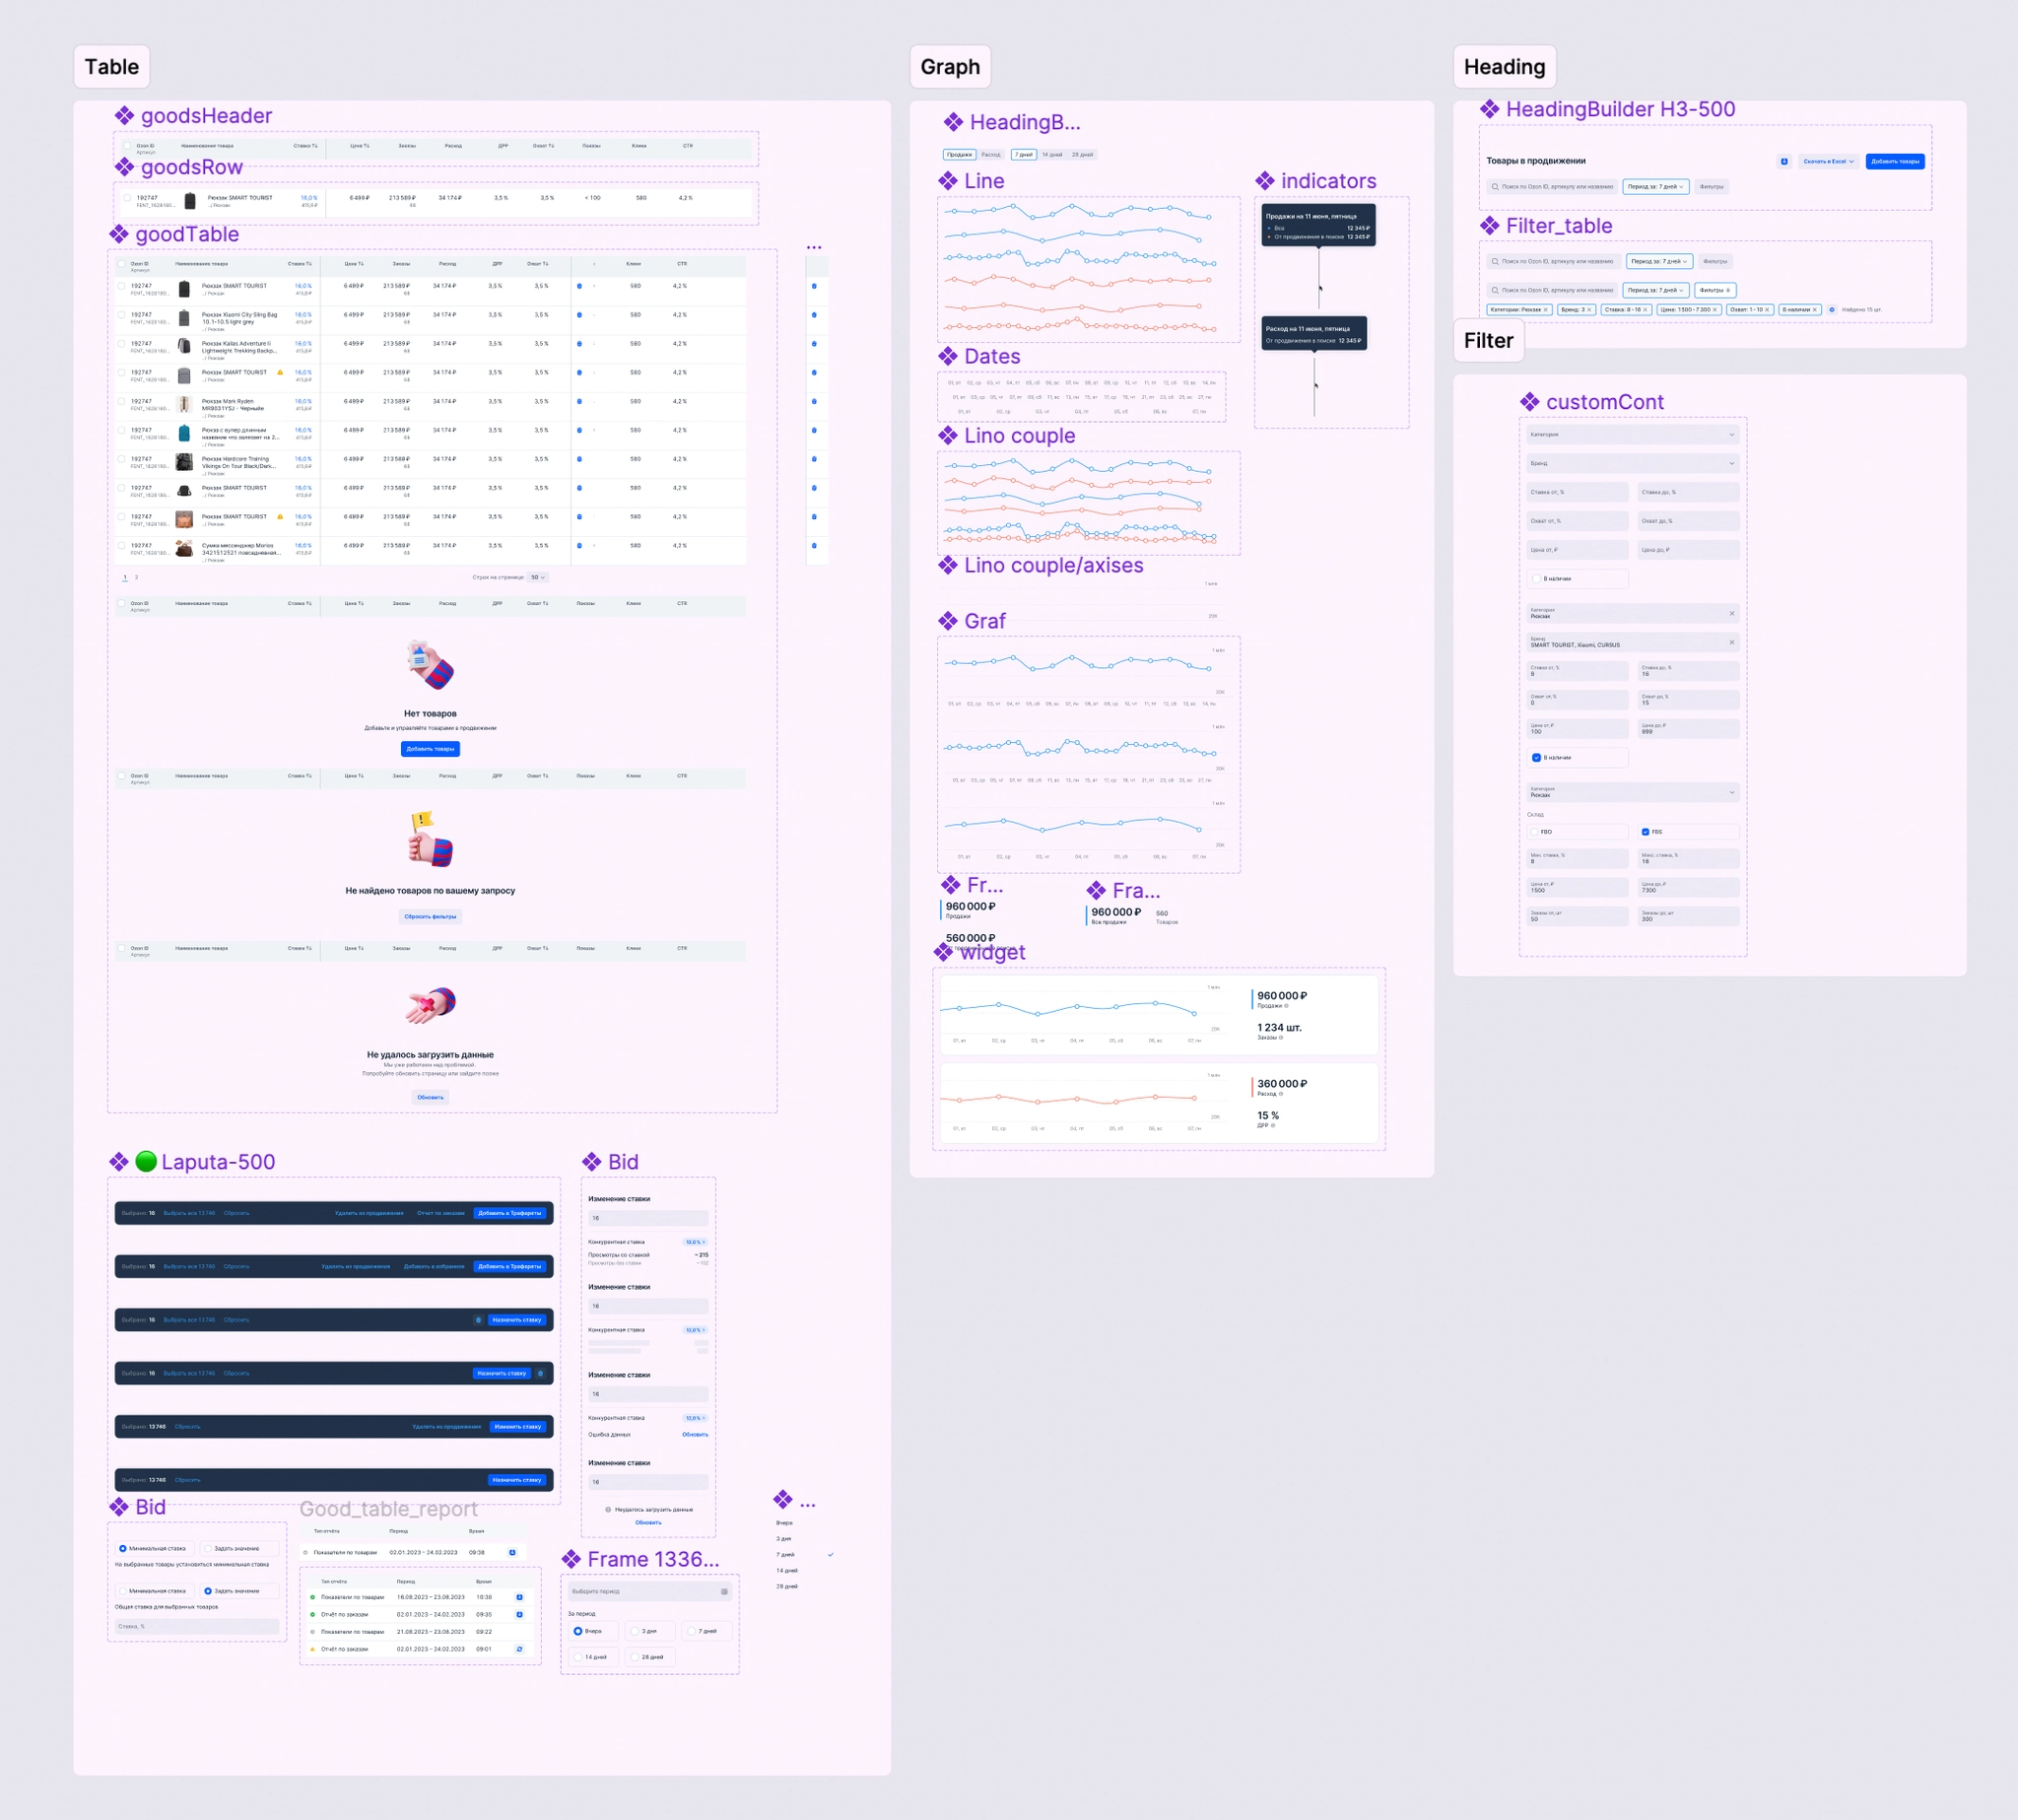
The project used the corporate component library, and I also created a local library of elements.
Result
We released the feature to 10 sellers first and then 500. We gathered feedback and analytics to shape the backlog and refine the designs. Five sellers took part in follow-up interviews.
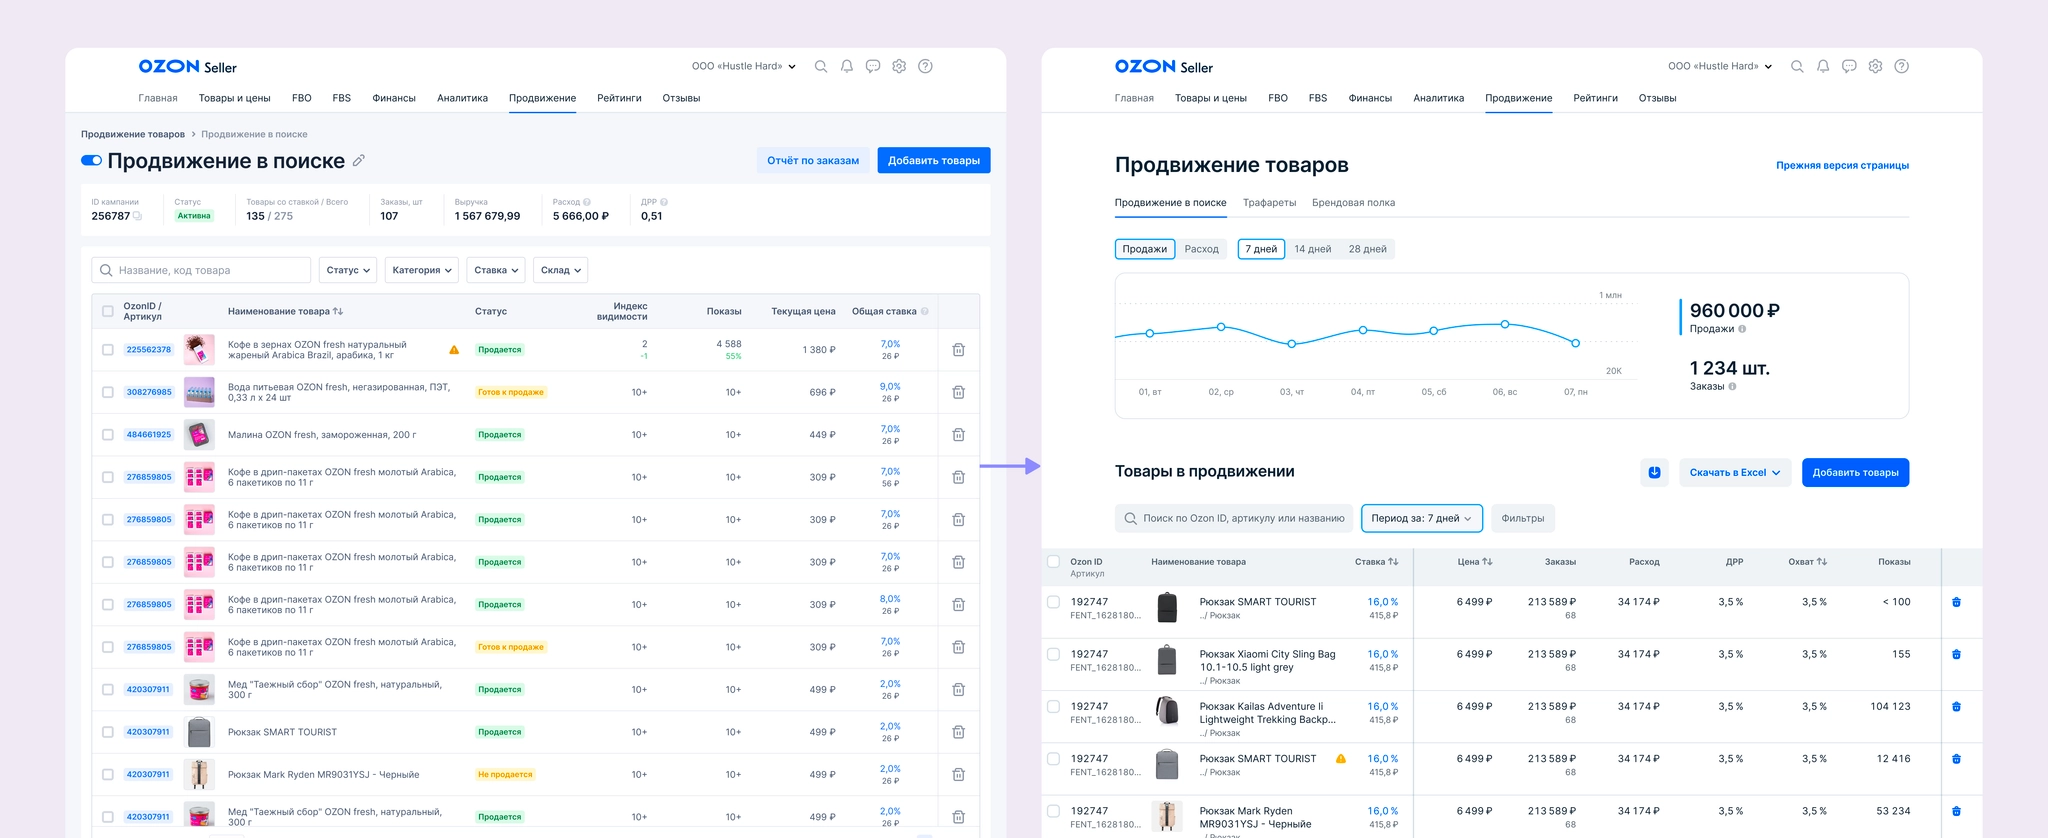
What worked well:
- Sellers gained product-level metrics they had not had before. Analytics showed them switching between the old and new views; our hypothesis was that they came back to inspect the new metrics.
- A combined chart showed trends for the key metrics and overall totals.
The critical limitation was the inability to turn promotion on or off for an individual SKU. We expected this and planned it for the next iteration.
Other pain points:
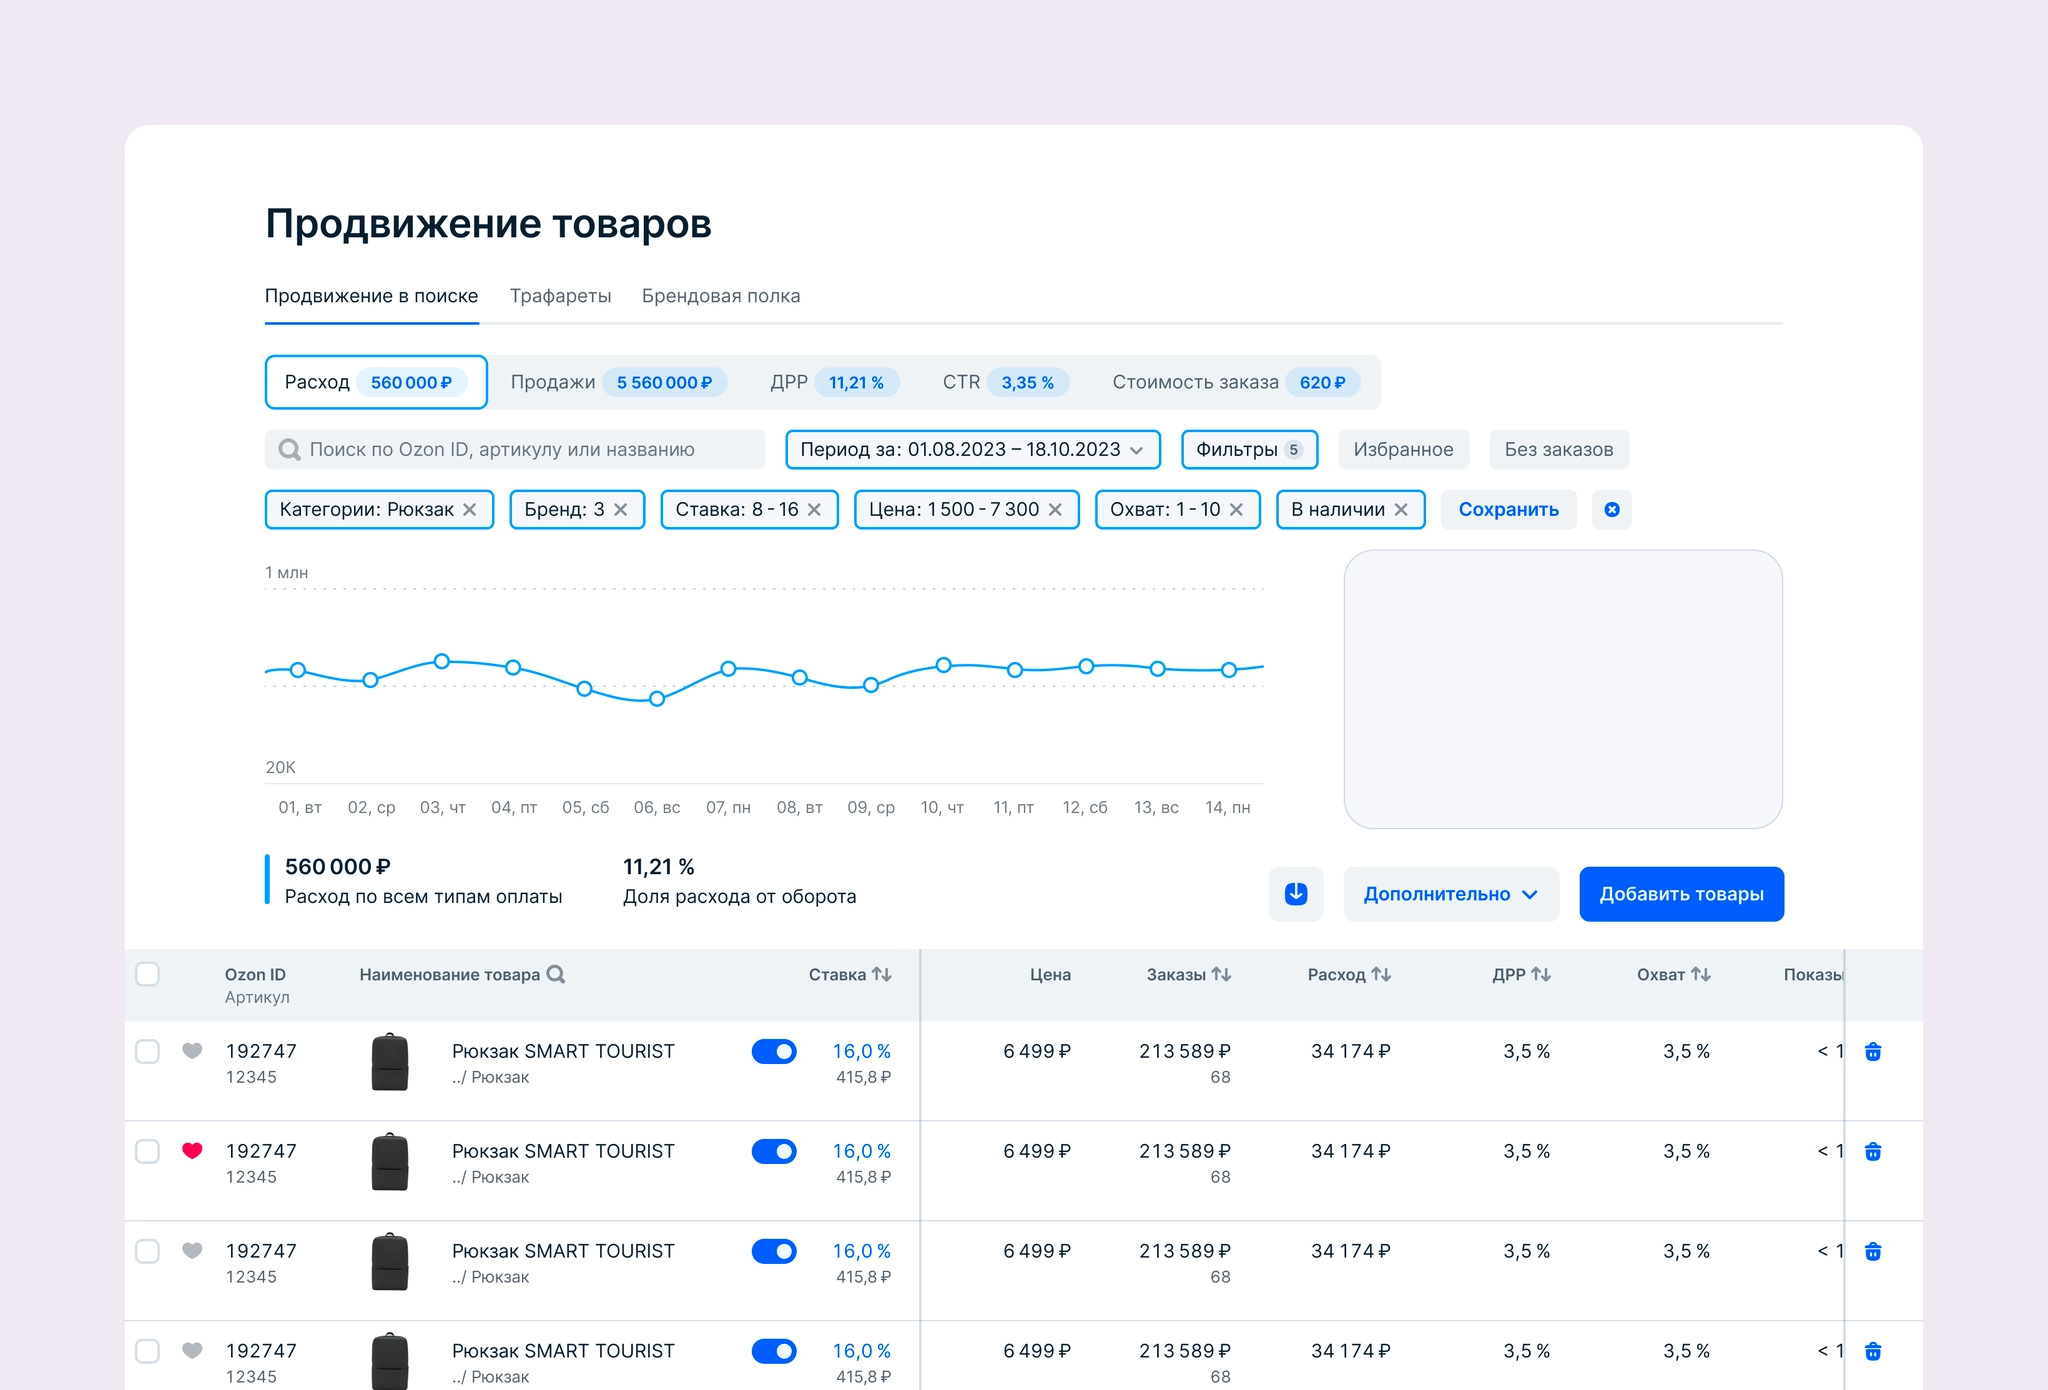
- No custom period for the table, charts, and reports;
- No sorting by column;
- No trend chart for a product group alongside the total;
- No visibility index;
- No date showing when a product was added to promotion.
Next steps
We agreed on the following features for the next iteration:
- Turn promotion on or off for individual products and in bulk, with a planned rollout to 3,000 sellers;
- Improve filters with saved filters, more metrics, and additional filter properties;
- Add favorite products for the 30% of sellers who need to group products;
- Let users choose dates and periods for the table and chart. The most-used presets were yesterday, 28 days, and 3 or 7 days, with the latter two used at roughly equal rates.
We deferred the analytics redesign because it was a larger task. We wanted analytics to extend beyond this one tool, which required additional product behavior and development resources. I had already explored a concept for it.